The US large-cap equity index, the S&P 500 (SPX), closed at 2092.83 last Friday, down 14.56 points for a net weekly loss of 0.68%, the second consecutive week of losses. The decline was predicated on good news for the real economy, which as often happens becomes bad news for the market.
The Non-Farm Payroll report last week was much better than expected – 275,000 new jobs created – and the Street immediately began thinking the good news would prompt the Fed to raise interest rates sooner rather than later, perhaps as soon as the FOMC meeting scheduled for next week. Investors opted for safety over greed and sold stocks.
In fact the market is almost looking for an excuse to decline, after an extremely long bull run and recent price action that is typical of short-term tops. The decline over the past two weeks was not severe, it didn’t do any serious damage to the long-term chart, the long-term and intermediate-term up-trends are still intact, and the SPX is still above the yearly pivot level. So why is everybody worried?
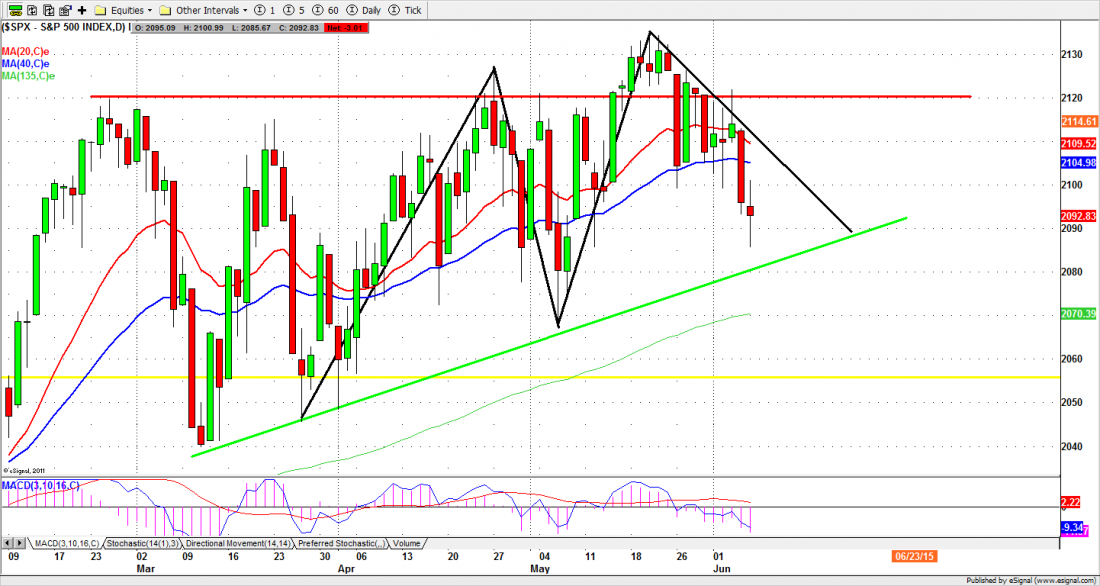
The answer may be found on the daily chart (below), where a big “M” pattern is forming which could be interpreted as a double top. That is a bearish pattern and it usually – but not always – precedes a decline.
The last time we saw a similar pattern on the daily chart (in October 2014) the market broke its 135-day moving average line and then fell an additional 6%. History does not always repeat, but we are watching the 2075-55 zone carefully in the coming days.
This week
There is not much in the way of economic data this week to ruin the party with more good news, so the market will be watching the FOMC meeting scheduled for June 16 and 17. The talking points will revolve around the possibility the Fed will raise rates at that meeting, or promise (yet again) to raise later this year.
A rate increase would certainly serve as a good excuse for moving the price around, and would generate a lot of short-term turmoil. But we don’t think the modest rate increase the Fed has discussed would have any lasting effect on the broad index.
As long as the SPX stays under 2150-35 for the rest of the summer we see the index moving inside a consolidation range around 2135 to 2015, until the market finds its footing for the next upside move. The next phase could well be a slow grind down toward the yearly pivot at 2055, perhaps followed by a further decline to 2015-1980 to complete a short-term correction.
In any event this is not the time of year to be buying stocks. There are still optimistic buyers who hope this market will advance further, and we think they will be right… eventually. But we are traders, and our focus is on the daily chart. The immediate outlook is for a further decline.
ESM5
The S&P 500 mini futures (ES) closed at 2092.25 on lighter volume Friday, below the 40-day moving average. This is bearish for the short-term. However the minis recovered from a dip down to 2083.50 intraday, and managed to close above 2089-90, which is a significant support area.
Today (Monday) this support is still a key area. A move below it could lead ES to retest last Friday’s low, or move lower toward the 2060-65 area if the price breaks through the 2078 line with strong momentum.
The 135-day moving average line below the current price should act as strong support to prevent a further decline, at least the first time the price touches it. As long as it holds, the ES could make some kind of bounce. However the futures are likely heading down toward the short-term uptrend line around 2075 in the coming days.
Thursday is rollover day, when traders will begin to switch to the September contract (ESU5). The price adjustments involved in the change will probably increase volatility near the end of the week.
Major support levels for Monday: 2082-84, 2070.50-75.50, 2065-62.50;
major resistance levels: 2107-06.50, 2122-25, 2134-36.5
To receive free market insights with actionable strategies from naturus.com, click here
CHART:
SPX Daily chart, June 5, 2015