

Although the Nasdaq futures have a nagging unfilled gap between 4428-4444, the NQ has been consolidating in a balanced manner. It may not feel ‘balanced’ if you are trying to trade it intraday, as the rallies and declines are rather abrupt.
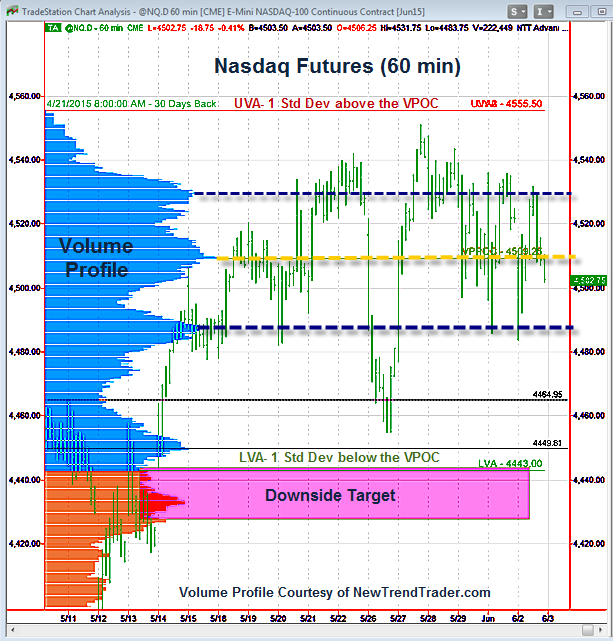
But if you look at the Volume Profile chart, the gold dashed line is the Volume Point of Control (VPOC). Price action over the last few weeks has been distributed in a semi-Gaussian manner around this central “volume pivot” with symmetrical secondary High Volume Nodes not quite one standard deviation on either side of it (the UVA at 4555 and the LVA at 4443, respectively.)
So far, the oft mentioned support from the High Volume Node at 4487 is providing a technical floor for the market.
While my upside target for the Nasdaq futures is 4617-4627, the chances of a surprise gap-fill run to the magenta zone are real. At the moment, this is a market waiting for a catalyst. Perhaps Grexit. Look for volatility to resume on Wednesday, a day before the Greek news is scheduled to be released, as markets typically anticipate news.
A Note on Volume Profile
The histogram on the left side of the chart shows the volume distribution in the Nasdaq futures for different periods of time. Key support and resistance levels are indicated by the peaks and troughs. If you would like to receive a primer on using Volume Profile, please click here.

