

Yesterday
The US equity markets moved a little higher yesterday after investors got an opportunity to examine the minutes of the last FOMC meeting and pronounced them moderately good. The ES closed at 2076 with a modest eight-point gain.
In the past few days, the market has been dominated by computer-driven algo trading programs, which are running the S&P down and then running it back up – in effect, just pushing the price around to run the stops. But the effect is to keep the ES moving inside a congestion zone which eventually will lead to an explosive break-out. It could go in either direction.
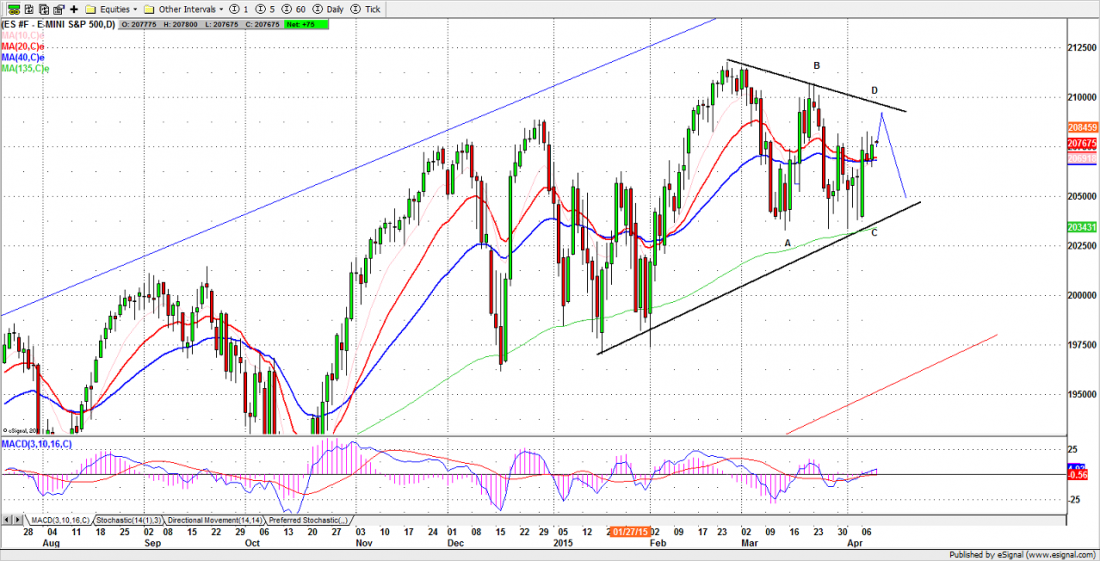
Yesterday’s TraderPlanet article (ESM5: Run The Stops, Shear The Sheep, Rinse And Repeat) mentioned a “triangle” pattern developing in the daily chart. The current congestion could change the A-B-C pattern we have been expecting into an A-B-C-D-E pattern.
So far, ES remains inside that triangle pattern. We just have to be patient to wait for breakout. Once the ES breaks out of this pattern, the breakout direction – up or down – will become the next major direction for the market.
Today
Today, 2082.75-81.75 is a key zone to watch. A move above it could lead ES to run up to 2093.75-2100 to make a D top.
2067-65 is the first support zone. A break below 2062.50 could push the price down to the uptrend line in the 2038-40 area.
We may see a whipsaw move that could catch some traders off guard, but experienced traders will wait for a clear breakout direction before jumping on board.
- Major support levels: 2055-56.50, 2045-43.25, 2035.50-33.50, 2028-29
- Major resistance levels: 2082.50-84.50, 2088.75-89.50, 2096-98.50
ESM5 Daily Chart, April 8, 2015
#####
Naturus.com publishes a free weekly analysis of US equity indices. To get on the mailing list, please click here.

