
Right now, weather is a little factor in the coffee market, as traders are looking over at sugar and cocoa, and are flooding money into these markets.
Key Points—
*Good early season for Brazil’s coffee bloom.
*Indonesia may have some problems due to El Nino, but with a weak El Nino, I’m not that confident problems will be that severe.
*Argentina grain areas could benefit from rains for planting. The corn, and especially the soybean market will be super sensitive to weather problems this fall and winter, due to last year’s big problems. Right now, look for a big rebound in production for corn and soybeans.
COFFEE MARKET AND EL NINO TALK
There has been a lot of talk about coffee and cocoa prices rising due to El Nino, and reductions of crops in Indonesia and Vietnam. There are also a couple of forecast firms discussing a drier than normal weather pattern
in Brazil, in which, if it continued for 2 weeks, according to them, might cause some concern in Minas Gerais. The most likely area of concern would be in Bahia, in my opinion, but still we have to watch Brazil. Along with the weaker dollar and coffee, perhaps just playing a little “catch up” with cocoa and sugar
prices which have soared…I wanted to alert you to what the “trade”, not necessarily to what I am thinking.
One analyst recently said, “Supply in Vietnam and Indonesia, which accounts for more than 50 percent of the global Robusta coffee production, could potentially be threatened by the weather phenomenon El Nino, which is a periodic warming of the ocean surface off the western coast of South America.”
Another one said this, “Stockpiling by Brazil, the top producer, with its crop of mainly Arabica beans, will also boost prices, he said. The government bought about 3 million 60-kilogram bags from domestic growers this month “to achieve higher prices. Even with recent gains, we still view coffee prices as too low and expect, in view of the tight market situation, significantly higher prices in the medium- to long-term. Previously speculators’ bets on large coffee crops have put prices under strong pressure. Prices will probably rise based on crop forecasts and stockpiling by governments of leading producers,” he said.
I heard talk that some forecasters are relating El Nino to possible reduction in both the Brazil and Indonesia crop. I believe the 2010-2011 Brazil coffee crop was initially estimated (on cycle year), to be at least 53-55 million bags. However, El Nino talk has forced some firms to lower their projected estimates to around 51 million bags.
KEY POINT—–Weather is really only a background factor in this market right now, and some of this El Nino talk may be hype. If I knew it was all Brazil weather, the market would be a selling opportunity soon, as ideal October weather should be the rule in most areas of Brazil. But seasonals and other factors are at play right now, as well as a technical break out in the market, some concern over Vietnam’s crop, etc.
HERE IS WHAT WE KNOW RIGHT NOW ABOUT THE WEATHER AND PRESENT CONDITIONS:
VIETNAM
Wet spring weather hurt the Vietnam crop and caused earlier than normal blooming. Since then, however, the weather has been favorable. Recently it has been wet. If the weather is wet in October and November, then some additional quality concerns to the crop would be likely.
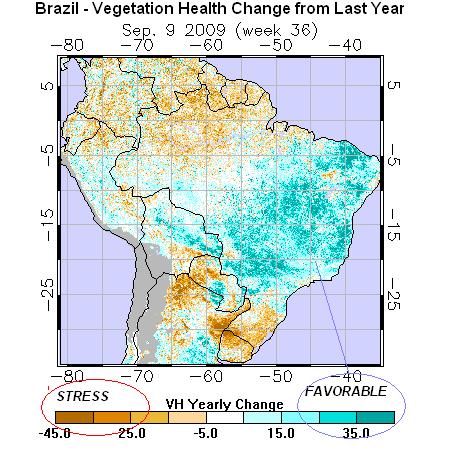
BRAZIL COFFEE
While great rains have fallen in S. Minas Gerais and Sao Paulo recently, there are “some forecasters” who are talking about a hot-dry pressure ridge, which, if it continued for more than 2 weeks, would result in some loss of early flowering next month.
INDONESIA
Although not a problem right now, El Nino sometimes lowers their crop, and there are some forecasters talking about it. Dry weather may be delaying the flowering cycle somewhat, although it isn’t a major problem just yet,
it has to be watched. A weak El Nino signal, however, may NOT cause any major problems. However, given what happened in India, just saying El Nino is weak and that their crop will be fine, is not sufficient enough. Further research is necessary.
(DID NOT UPDATE THIS, THIS WEEK, BUT STILL YOU CAN SEE THE GOOD CONDITIONS)
WHAT ABOUT EL NINO? IS IT LIKE IN 2006?
There are some climatological elements, in which even “weak El Nino’s” can cause problems in some countries such as India, Indonesia and others. For example, the weak 2006 El Nino created weather problems for wheat all over the world. During the 2006 event, however, the SOI index was quite a bit more negative than it is now. Hence, although the hurricane season is feeble like 2006; these two El Niño’s are quite different from several perspectives.
STATE OF EL NINO, AND A LOOK AT THE MEI INDEX—WHAT IS IT?
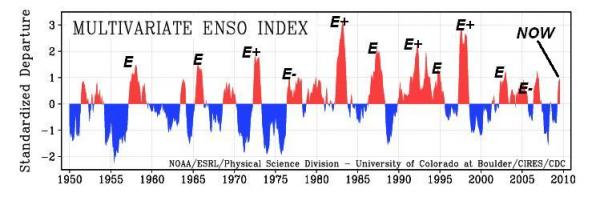
MEI INDEX (MULTI-VARIATE ENSO INDEX)
There are six main observed variables in determining El Nino, and the MEI index attempts to “weight,” and then classify them. From Sea Surface Temps to the SOI index and cloudiness over the date-line-positive (red values), are typically associated with El Nino conditions, and negative (blue) values with La Nina conditions. It should be noted, however, that not all positive (+) and negative (-) values are always associated with either El Nino or La Nina conditions. There are cases when neither exists.
While Sea Surface Temperatures remain modestly above the threshold for El Nino conditions, other signals such as the SOI index not being negative and a lack of cloudiness at the date line, continue to suggest that this El Nino, is very unusual and remains weak. Don’t tell that, however, to people living in India.
So what’s the bottom line? Although footprints of El Nino may exist climatogically in certain parts of the world, (i.e. India), without more consistent evidence from a -SOI index and other criteria, using El Nino to forecast typical fall and winter trends, will, by itself lead to more forecasting errors. Nevertheless, for now, we wanted to look at weak El Nino events, directly following La Nina in trying to determine what Brazil rainfall might be like. For this, we look at similar MEI index values.
So what else can we look at to forecast Brazil’s weather? The AAO index and the TSA (Tropical South Atlantic Index).
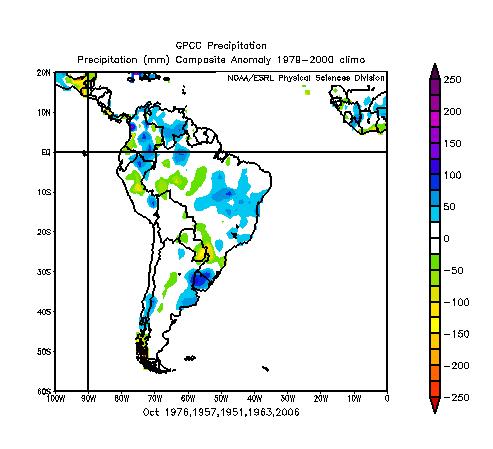
1) SIMILAR MEI INDEX VALUES
In all weak El Nino years that directly followed a La Nina within 6 months of it ending, you can see the trend below of good October rains for N. Brazil and perhaps for parts of Argentina.
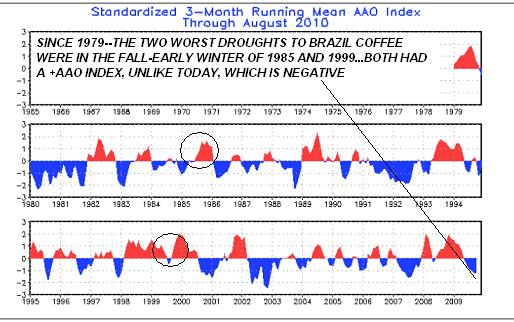
2) THE AAO INDEX–Very negative this summer bodes well for good rains in N. Brazil coffee areas and wetness to sugarcane
The AAO index, if negative this fall, might suggest below normal
rainfall in Brazil coffee areas and an excellent chance for heavy
rains over southern Brazil and perhaps parts of Argentina. However,
this is just one teleconnection. Of more importance might be the
trend and fact that the AAO index this summer was so negative
(the most since 2002-2003). A highly negative AAO index is somewhat
related to good fall moisture in much of Brazil. More problems for
sugar, but good for coffee crops.
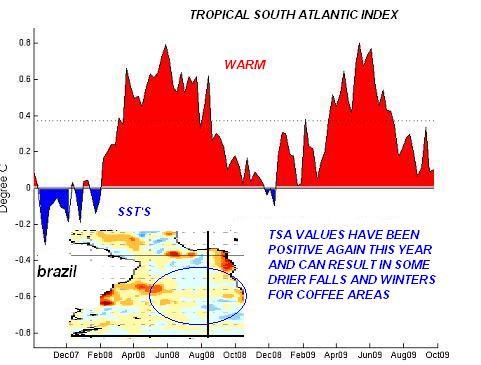
3) THE TSA INDEX
The Tropical Southern Atlantic Index has some slight relationship
with Brazil and Argentina weather. This index was positive most of
the summer, meaning sea surface temps east of Brazil and to the west
of Africa were warmer than normal, ( too simple an explanation).
Normally this would suggest a dry spell over Argentina and southern
Brazil, and good rains over northern Brazil coffee. The index has
been trending less positive, however, so using this index is not
of high confidence right now to forecast S American weather.
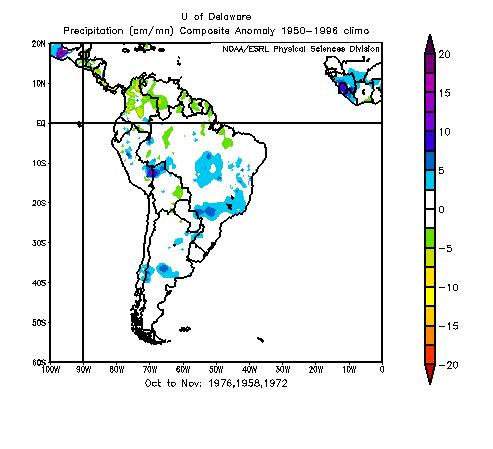
4) India’s drought is the worst since 1972, U.S. weather similar to 1958/1976? Can we use similar weather patterns to forecast for other parts of the world?
One is playing with fire in trying to correlate one part of the world’s weather with another. Just for kicks, here is what happened in October-December in South America (blue above normal rainfall), during 1972. It was wet (blue), over most of the main coffee areas through fall. Other analogs that look somewhat similar to the U.S. weather pattern, might be 1976 (A year Jeff discussed months ago might mean a cold winter) and 1958, an analog year I used this summer and fall. 1958 had a weak El Nino and very similar strong negative AO (not -AAO), index in the northern hemisphere. Those two years happened to see above normal rainfall through November in key coffee areas of northern Brazil—
Key Point–Although using analogs in other parts of the world is not always a wise choice to forecast for a completely different region– 1972, 1958 and 1976, which had at least some relationship in the northern hemisphere with either a weak Indian Monsoon, or similar U.S. weather trends, suggested good fall weather for Brazil coffee. In addition, it appears that most Argentina corn and soybean regions had at least normal rainfall, which may suggest an easing of the drought for fall planting for corn and soybeans.
5) CONCLUSION
ARGENTINA CORN AND BEANS (PLANTING SEASON-OCT-NOV.)
Droughts in Argentina, similar to last year, occur most frequently during La Nina years. This is especially true if the AAO index is positive during the fall and the TSA is negative. Given the fact that there is still some influence from the weak El Nino, the TSA is slightly positive, and the AAO index has trended mostly neutral to negative, look for improvement in key regions for planting and early soil moisture for corn and soybeans. If anything, there may be some talk in a month or two about it being too wet up north in Brazil. If El Nino weakens, the AO index goes positive later this fall, chances might increase for problems in Argentina, but right now I’m leaning against it.
BRAZIL COFFEE
The worst drought years that had a market impact were 1963, 1985, and 1999. One of these years was an El Nino (1963), and the other two were weak La Nina years. There is a tendency for Bahia and the far northern coffee areas to see below normal rainfall during El Nino, but the correlation with any major production problems during
El Nino is low (more so over Indonesia). While the TSA, AAO index, etc. suggest some different solutions, using the MEI index scale and looking at analogs such as 1976 and 1958 (more of a N. Hemp influence and possibly cold US. winter), suggest a good start to the coffee crop in Brazil and “may eventually” be bearish the market sometime this fall.
COFFEE PRICE SEASONALITY
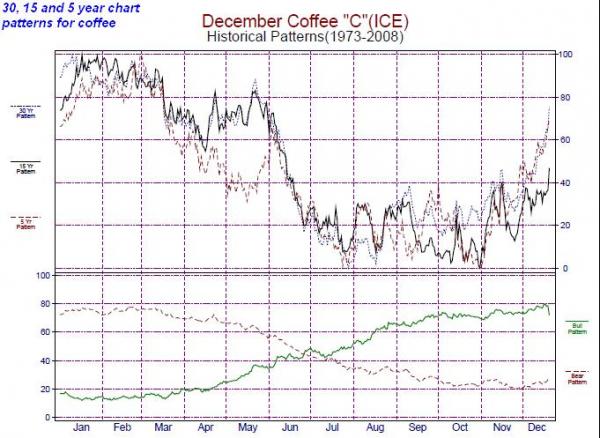
Upper Chart Legend:
- the solid magenta line represents the pattern of the most recent 30 years (1979-2008)
- the solid black line represents the pattern of the most recent 15 years (1994-2008)
- the dashed red line represents the pattern of the most recent 5 years (2004-2008)
Lower Chart Legend:
- the solid green up-trending line represents the 7 year bull pattern – from most-least bullish
- the dashed red down-trending line represents the 17 year bear pattern – from least-most bearish
- the 12 neutral years are not represented on the chart
THERE IS NOT A STRONG CORRELATION, EITHER WAY, OVER THE NEXT 4 WEEKS OF A BULLISH OR BEARISH TREND BASED STRICTLY ON SEASONALS IN COFFEE—
ROEMER

