

The Forex market has always been known for its strong trends. However, even in directional markets technical traders have some serious decisions to make regarding when to enter and exit the market. Often to solve these difficult trading concerns, traders rely on technical indicators. These indicators can be helpful, but more often than not, traders will find them inconsistent and lagging in nature. So what is a trader to do?
One of the alternatives to a technical indicator is price action analysis. Price action analysis is simply the study of price to determine market direction in order to establish and manage a traded position. While the concept may seem difficult at first, the good news is that, more often than not you are already doing some form of price analysis on your charts without even thinking about it! To get you up to speed, today we will review some of the basics of price action trading. Let’s get started!
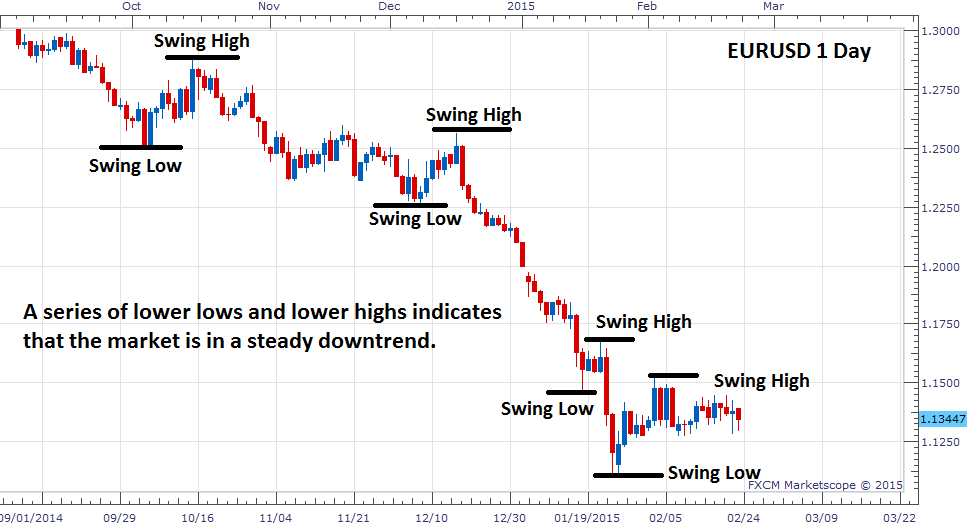
Swing Highs and Lows
A market swing is a direct reference to the price action being displayed on the graph. Since price rarely heads in one specific direction, even in strong trending markets, a swing helps define the changes in price. A swing high is looking at the current high displayed on a graph, while a swing low represents the current outstanding low. Typically price action traders will use these swings to define the trend. If the swing highs are getting higher and the lows are getting higher as well, that is a sign of a strong uptrend. Conversely, if a series of lower lows and lower highs are created, the trend is said to be down.
Normally, traders look to trade swings back in the direction of the trend. These swings against longer term momentum are known as retracements and allow traders excellent trading opportunities. Much like in the example with the EURUSD daily chart below, any pullback in an extended downtrend can be seen as an opportunity to sell into the market at a higher price.
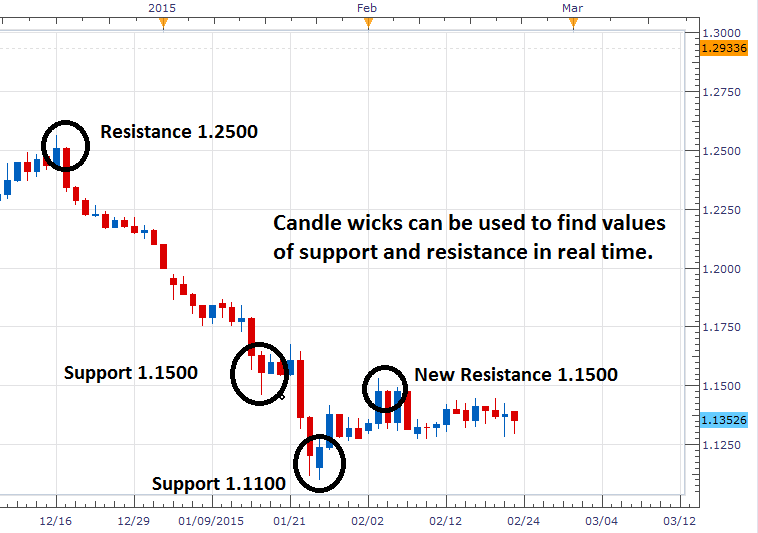
Candle Wicks
Candlestick wicks are also an important part of price action trading. These lines that stick out above and below a candles real body, known as shadows, help determine where current values of support and resistance lie. Normally, these wicks appear when price penetrates through a designated point on the chart but fails to close towards a higher high or a lower low. A price action trader can use this information to move stops or even plan their next breakout!
Below, we can see a series of wicks at critical points again on the EURUSD daily chart. The first highlighted wick, near 1.2500, shows price failing to break to a higher high. Knowing that price is being resisted here, can add credibility to the current trend. As well, it allows price action traders a new value of resistance to place new protective stop orders on existing sell positions. Conversely, the next wick at 1.1500 indicates an area of support. Traders watching price action could use this information to initiate new entry orders upon a price breakout at this area. As we discussed previously, a new lower low is a strong indication of a trend continuation.
Candle Patterns
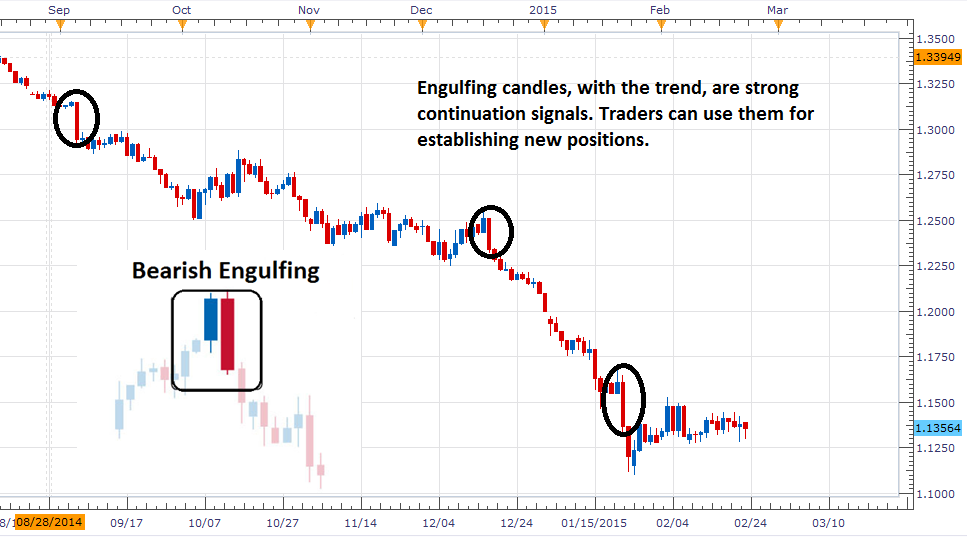
Wicks are not the only part of the candle useful to price action traders. Candle patterns can also give clues about the markets current direction. When it comes to trending markets traders should pay close attention to the bullish and bearish engulfing patterns. These patterns can signal strong continuations along with reversals in the trend. An engulfing pattern incorporates two candles. The key is to look for the real body of the second candle to cover or engulf the primary candle. Once they are identified, traders can gauge the strength of the market and plan future positions.
Below we can see the EURUSD again on the daily chart. As we discussed prior the pair has been in a strong downtrend, but notice how there were pauses in market direction along the way. While this is perfectly normal, many traders at these points were giving up on the EURUSD downtrend. However, each time a new bearish engulfing candle is printed, it should be taken as a signal that the trend is still intact. While the engulfing candle pattern is far from the only pattern seen on this chart, the ease at which they are identified make it a “must know” for any serious price action trader.
Putting it all Together
Just like other styles of trading, understanding price action can easily be worked into any existing trading strategy if you know what to look for. While it may seem overwhelming at first, remember you don’t have to trade every single candle that you come across. To help get you started, I recommend spending some time in front of your charts! The beauty of price action is that it is right in front of us all of the time. So be patient and continue to work on your new trading skills.
#####
For more about Walker England, DailyFX instructor, please click here.

