

On August 23, 1972, the late technician, George Lindsay, made a presentation to the Society for the Investigation of Recurring Events (S.I.R.E.) in New York City. In that presentation, he explained his preliminary low sequence.
Rather than the terms bull and bear markets (which can be of almost any duration), Lindsay created a concept called basic advances and basic declines. These basic movements are timed using his standard time spans. He found that, since 1798, all bull and bear markets fit into this concept. When a basic decline terminates prior to the final low of a bear market, that higher low was called a preliminary low (point 1).
Lindsay’ principle of continuity directs us to count the next basic advance from that low, rather than the ultimate low. Lindsay found anytime a basic advance is counted from a preliminary low, the market action resembles Figure 1 below. The most important and interesting idiosyncrasy of this period is that the period just before and after point 5 has always been marked by slow and halting movement (see George Lindsay and the Art of Technical Analysis, FT Press, 2011).
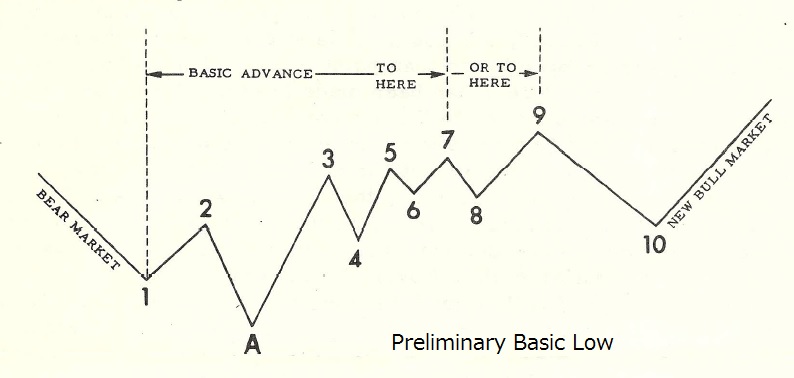
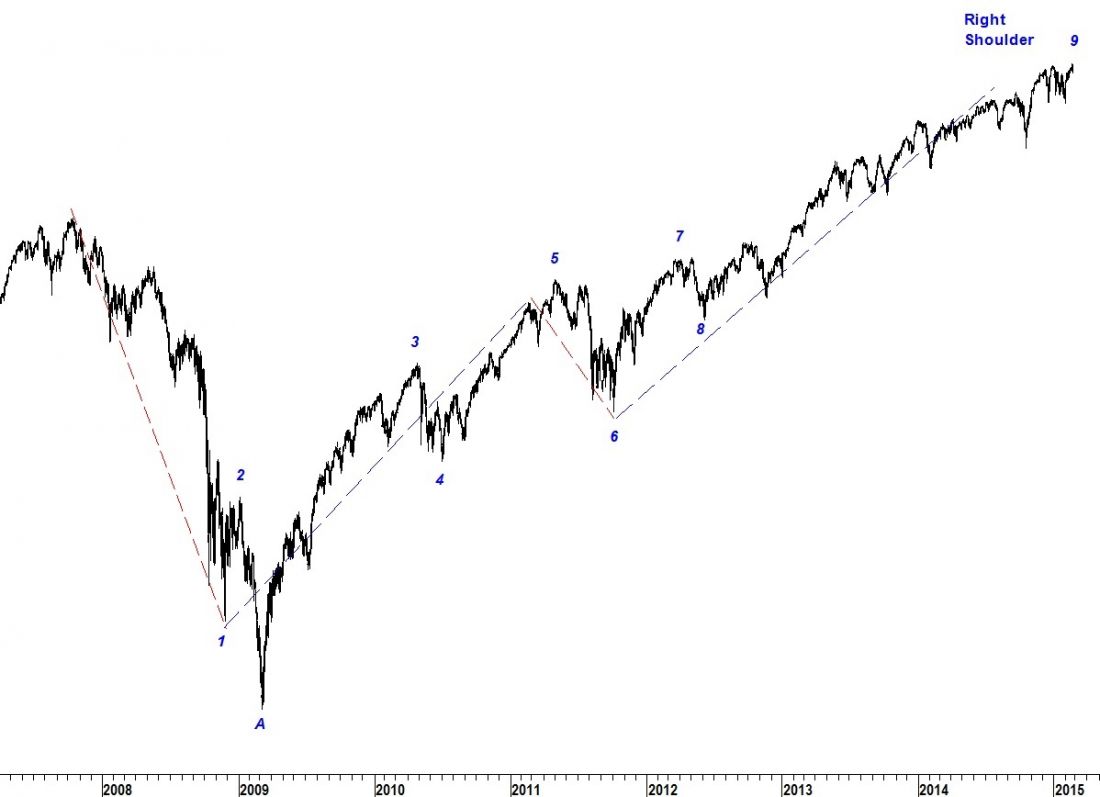
With the basic decline from the 2007 bull market top having ended in November 2008, the next basic advance is counted from that preliminary low and the time since then resembles Lindsay’s template above. The pattern warns of a bull market top in the near future.
To be continued next week …
#####
To get a “sneak-peek” (trial subscription), please click here.

