

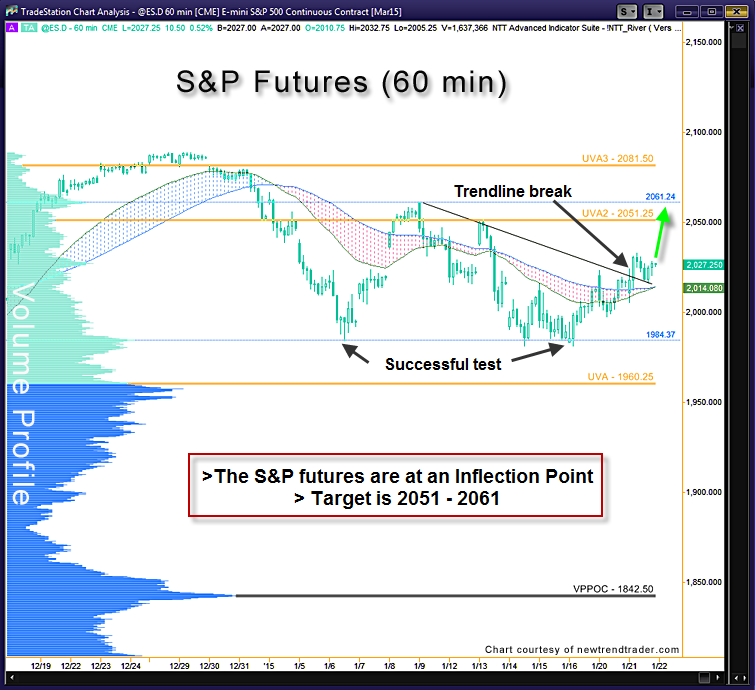
The S&P 500 futures survived a very important test over the last few days at the 1984 level, as you can see on the year-long Volume Profile on the left side of the chart below. This support level has been in place for many months.
On Tuesday, the index broke up through a down-trend line stretching back to 1/9. That was a bullish development. On Wednesday it tested that trend line from above and it held as support.
This suggests that higher prices are a distinct possibility. Short term targets are 2051 and 2061.
A Note on Volume Profile
The histogram on the left side of the chart shows the volume distribution in the S&P futures for the entire year of 2014 through today. Key levels are indicated by the peaks and troughs.
To contact me for a primer on using Volume Profile, please click here.

