For the first time in a while we are going to run through one of the various relationships that we use for Boston Scientific (BSX). We have included a second view on page 5 today.
The argument begins with the observation that BSX tends to trend in the opposite direction of strong cyclical trends. In other words the stock tends to do better when money isn’t focusing too intently on rising asset prices.
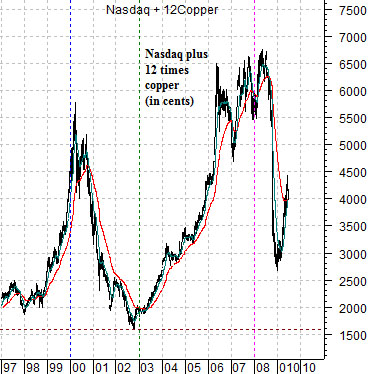
Immediately below we show a chart consisting of the Nasdaq Composite Index and the sum of 12 times copper futures (in cents). The chart is based on the idea that the peak for the Nasdaq in 2000 was around 5000 while the cycle top for copper between 2006 and 2008 was just over 4.00 (400). Twelve times peak copper futures prices would therefore be about the same as the high water mark for the Nasdaq close to a decade ago.
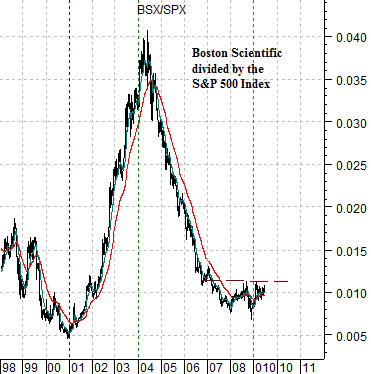
Below we show a chart of the ratio between Boston Scientific and the S&P 500 Index (BSX/SPX). What we are looking for are the points in time when BSX either began to strengthen or weaken relative to the broad market.
The final twist has to do with the fact that the charts are offset in time by one year. We have lined up the peak for the sum of the Nasdaq and copper prices in 2000, for example, with the bottom for BSX relative to the broad market in 2001.
The chart-based argument would be that when there is a dominant cyclical theme involving either tech or base metals prices the share price of BSX will tend to weaken against the broad market. In other words as long as money has something more exciting to do it will tend to ignore the health care sector.
On the other hand… once the cyclical trend turns negative with the sum of the Nasdaq and copper prices turning lower we tend to get offsetting strength in BSX. Obviously much of this is intuitive because a strong Nasdaq or mining sector will almost by definition put downward pressure on the BSX/SPX ratio but our point is that the swings are still rather wide. Between 2001 and early 2004 the BSX/SPX ratio rose 8-fold only to lose virtually all of the gains into 2008.
Our point is that the one-year lag suggests that BSX should be ready to return to relative strength so this will be one of the stocks that we will be focusing on over the next few months.
Equity/Bond Markets
Earlier this week the European Central Bank slipped in what Goldman Sachs called a ‘stealth ease’ by lending over 440 billion euros to a large number of European banks for one year. This is the equivalent of around 1,300 euros per man, woman, and child in the Euro-zone. In other words… a big number.
The ‘stealth ease’ may be sufficient to turn the long end of the bond market higher through the second half of the year as banks begin the process of taking money borrowed at 1% and buying long-term bonds to earn the carry. For all intents and purposes this has the potential to act as a strong positive not only for the bond market but also for the equity markets.
Consider, for example, that the yield on 10-year Treasuries is close to 3.5% while the dividend yields for Coca Cola and Johnson and Johnson are roughly 3.4%.
There is a fairly significant difference between a bond market rising in the face of an economic crisis and one that rises as long-term yields are slowly squeezed down towards short-term yields. In the former case asset prices decline while in the latter they tend to rise. Our view is that the second half of the year should feature a rotation out through the bond market as prices rise that helps to expand valuations within the equity markets. In other words… a fairly positive perspective with the caveat that we have been looking for the equity markets to remain under pressure through July with a better trend developing in August.
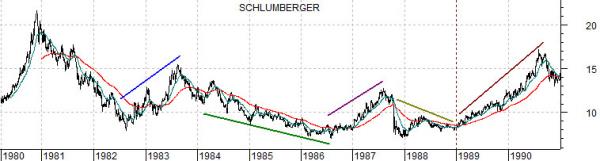
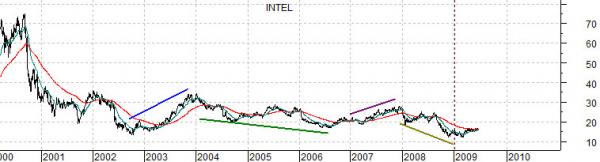
Below we show a chart of Intel (INTC) from 2000 into 2009 and a chart of oil service giant Schlumberger (SLB) from 1980 into 1990.
We have done this argument on a few occasions in the past but given that it is still basically working we thought that we would run through it once again.
The idea begins with the observation that one way or another we keep reaching cyclical asset price peaks at the start of new decades. The commodity markets peaked in 1980, the Nikkei reached a cycle top in 1990, and the Nasdaq hit its final bubble top in 2000.
Now… before we proceed we should mention that we do realize that what we are suggesting is in some ways contradictory with today’s first page. We argued to start today’s issue that the BSX/SPX ratio tends to turn higher after cyclical asset prices peak while on this page we are arguing that cyclical tops tend to occur at the start of a new decade (i.e. 2010). Since we have a hard time reconciling the two views we will simply note the inconsistency and then push on as if it didn’t exist.
One of our views is that cyclical is cyclical which means that during a period of economic strength all cyclical markets will rise in tandem even though one theme will tend to dominate. Oil prices were very strong into 1990 and 2000 even though the trend was focused on Asia and tech respectively.
In any event the share price of SLB topped out towards the end of 1980, bottomed in 1982, hit a high in 1983, declined all the way through into 1986, and the rallied smartly higher until the stock market collapsed in 1987. By the end of 1988 the stock price had washed for the decade and was ready to turn sustainably higher even though commodity prices were not the dominant cyclical theme.
Our recurring thought is that the Nasdaq in general and stocks such as Intel and Cisco in particular have reached a point in time in 2009 that is the broad equivalent to SLB back in 1989. Intel peaked in 2000, bottomed in 2002, rallied through 2003, and then ground lower into 2006 before turning higher until the stock market collapsed in 2007. If history were to repeat a stronger cyclical theme would carry through into next year pushing Intel back up towards or even through the 30 level.