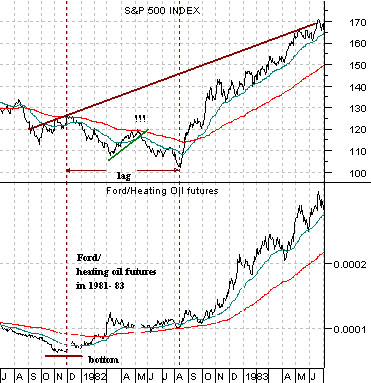
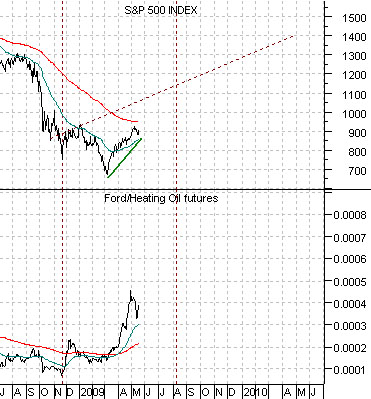
Belowwe show two chart comparisons between the S&P 500 Index (SPX) and the ratio between the share price of Ford (F) and heating oil futures. The top chart is from 1981 into 1983 while the lower chart is from the current time period.
We have shown this comparison on a number of occasions over the past few quarters but the idea was that when the ratio between Ford and heating oil prices hit bottom and turned upwards this would mark the start of a positive ‘base trend’ for the equity markets.
The key, however, is that a rising ‘base trend’ does not always go with rising prices. The Ford/heating oil ratio bottomed out in late 1981 close to nine months ahead of the cycle bottom for the S&P 500 Index so there was a considerable lag between the start of a rising ‘base trend’ and the lows for stock prices.
From our perspective from late 1981 into the summer of 1982 the stock market pushed down and away from a rising trend. The greater the divergence between actual prices and ‘trend’ the faster and more relentless the eventual rally. By mid-2003 the SPX had returned to the trend line established during the final quarter of 2001.
The chart below shows that the Ford/heating oil ratio hit bottom during the final quarter of 2008 so our view is and has been that the ‘base trend’ for equities is now positive.
The detail that may well get us into trouble- only time will tell now- has to do with our argument that similar to 1982 there should be a lag between the bottom of the Ford/heating oil ratio and the start of a sustained up trend for the SPX. In other words our expectation was that the equity markets would remain under pressure into August before swinging back up into a recovery similar to late 1982.
Our thesis was that the SPX would rally higher from March into May and then decline or consolidate into August. In early March the idea that the stock market could actually rise seemed quite daring while today the argument that it will stop rising seems equally farfetched.
Our point today is that we are walking a fairly fine line with this one because on the one hand we are equity markets positive now that the autos/energy prices ratio has turned upwards even as we argue in favor of lower prices.
Equity/Bond Markets
We are equity markets positive although we are looking for prices to decline over the next three months. On the other hand we are bond markets negative even though we expect bond prices to resolve back to the upside for the next few months as well.
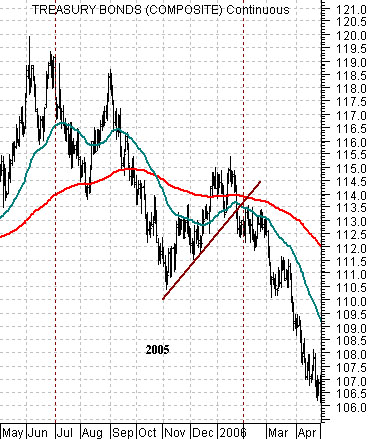
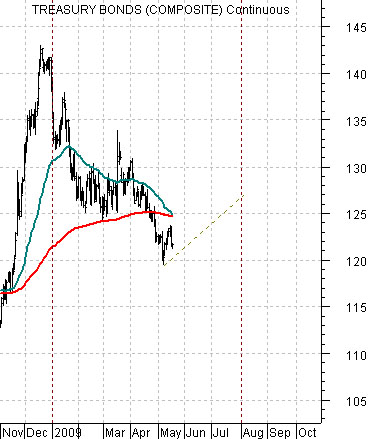
Below we show a chart of the U.S. 30-year T-Bond futures from 2005- 2006 while below right we show the TBond futures from the current time frame. We are attempting to paint a picture through this comparison.
If the markets behave as we expect then the TBonds in May of this year are in roughly the same position as November of 2005. After peaking in price late in the second quarter of 2005 the TBonds declined into November, rallied higher through into January of 2006, and then broke to new lows into 2006.
The argument is that cyclical growth has a tendency to peak during the month of May which should lead to a bottom for bond prices. In a perfect world the long end of the Treasury market would drift back above its moving average lines through into July before turning back to the down side through into year end. Our target for the TBonds is roughly 110.
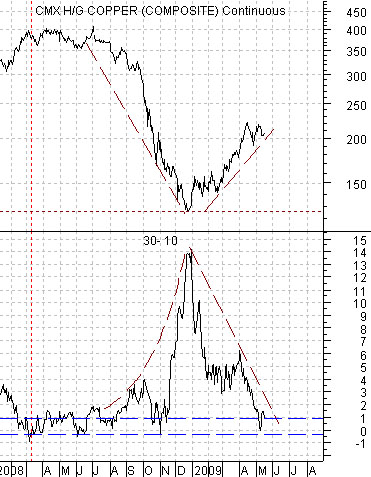
Below we feature a chart of copper futures along with the price spread or difference between the 30-year and 10-year Treasury futures. The argument is that through the last few years the peak for copper prices has been made when the spread has pulled back towards ‘0’. In other words the closer the 30-year and 10-year Treasury futures prices get to converging the more likely it is that we have reached a medium-term top for base metals prices. Rising bond prices, by the way, widen the spread while declining bond prices pull the spread lower.