

Last week the S&P 500 (SPX) made its biggest one-week decline since August 2011. And it did it in just a few hours, starting Thursday morning following a mild FOMC report and good GDP numbers, and so-so but not disastrous employment data.
There was nothing in the data that hasn’t been seen before – and usually it sparked a rally. But this time the buyers had had enough, and the sentiment turned decidedly bearish. The SPX ended the week 66 points below the previous high at 1991.37. We’re now back where we were at the end of May.
So is this the big one – the beginning of the crack in the market everybody has been waiting for so breathlessly?
Maybe. But it ain’t a sure thing yet.
Short Term Outlook
The SPX broke below 1945 last week, and closed below it, which is a bearish sign. The weekly chart (below) shows four successive weeks of narrower-than-usual weekly ranges, which indicates a lack of interest from buyers. The lack of volatility also encouraged buyers to stand aside. Nobody makes any money unless the market moves.
The decline last week confirms for us that 1991 is the short-term top. But so far the SPX is still well within the uptrend channel, and the retracement – a very modest 2.6% so far – looks less threatening now than it did on Friday.
Our short-term outlook is for a retracement to 1878-60 or further down to 1830, although we may see a bounce this week to re-test 1945-1950.
The SPX needs to stay below 1950 and break below 1900 to achieve our downside targets. If the index holds above 1900 level, the intermediate-term outlook remains bullish.
However last week we saw selling on (relatively) good news and that usually means sentiment is changing – and so is the trend.
Bottom line: short-term bear.
Long Term Outlook
For the longer term, we are waiting for a resolution of two conflicting Elliott Wave counts. Without picking through the entrails too much, a decline that stops around 1820-1835 would suggest a further leg up in the long-term bull market carrying us past 2000 to 2040 or higher.
A decline that falls below 1800 would indicate that 1991 was the top of primary wave 3, and we are entering a wave 4 correction, a longer decline with downside targets around 1730 (20%), 1665 (25%) and 1585 (30%).
Bottom line: long-term undecided.
The Fed Can Change Everything
But the Joker in this house of cards is the Fed. If the market looks to be moving too far down too quickly the Fed may switch gears, and the talk of “tapering” QE will be replaced by soothing rhetoric. Some “stay calm and carry on” stories have already begun to appear.
In any event the fuel that has been driving this market up is low or zero interest rates, which may not contribute much to the real economy, but make the equity markets look like the only alternative to the steady erosion of capital through currency debasement.
It is hard to imagine any real increase in interest rates in the immediate future, and certainly not before the next election. After all, even a small increase in rates would be a disaster for the world’s biggest debtor, a.k.a. the U.S. government.
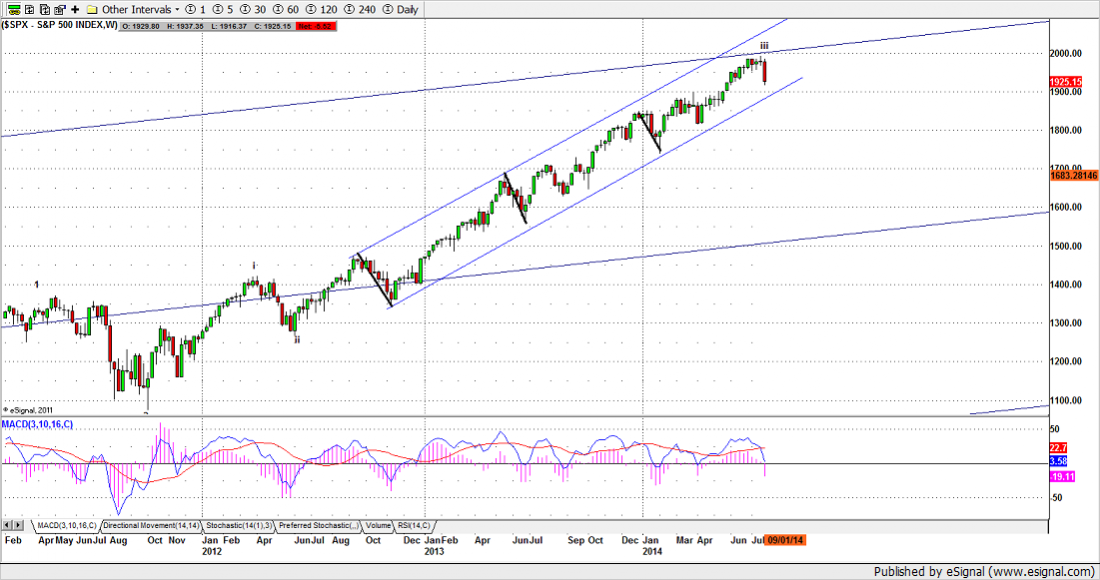
SPX weekly chart, Aug. 1, 2014
Related Reading
Read another story by this author:

