

The Gartley pattern is a technical complex price pattern based on Fibonacci numbers/ratios. It is used to determine buy and sell signals by measuring price retracements of a stock’s up and down movement in stock price
Bearish Set Up
There are both bullish and bearish Gartley set up’s and AAPL (Apple Inc) is showing us a possible bearish Gartley pattern set up, which you must pay attention too. The Gartley pattern is one that I really like to use. Typically, when you see a stock or index that has retraced 78% of move, that Fib spot is a good place to look for some type of reversal. This is how the Gartley pattern price objectives look like.
Using Fibonacci ratios, the retracement of waves AB should be 61.8% of the price range A minus X, as shown by line XB. At B, the price reverses again. In a perfect set up, retracement BC should be between 61.8% and 78.6% of the AB price range, not the length of the lines, and is shown along the line AC.
At C, the price again reverses with retracement CD between 127% and 161.8% of the range BC. Price D is the trade point (bullish/bearish Gartley pattern) as that is where price should reverse if the pattern is in play.
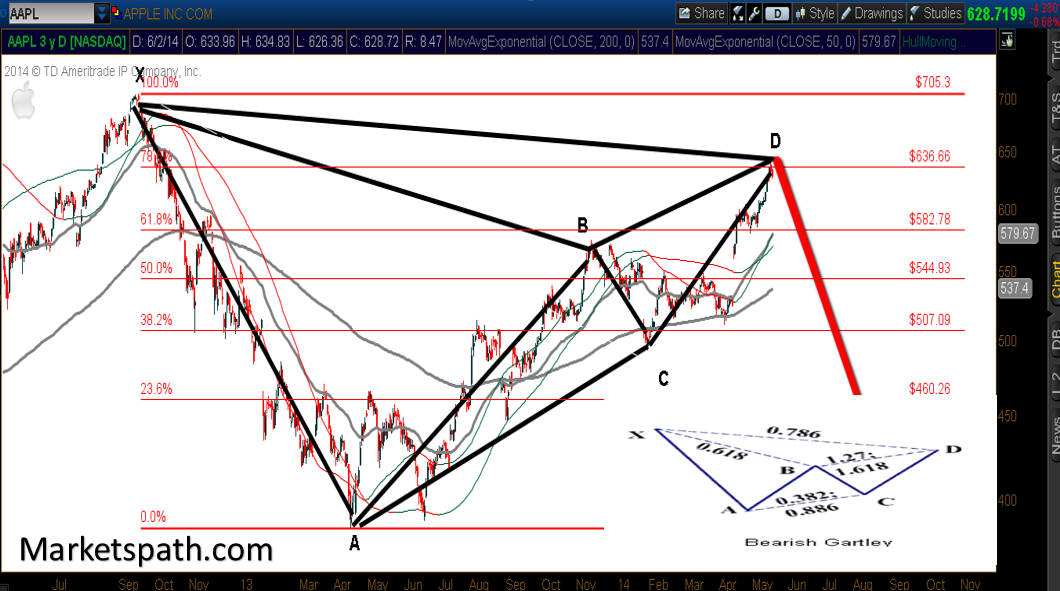
As you can see in the chart of AAPL above, AAPL has had a great move higher from the 385 lows. But it is following the bearish Gartley pattern almost to a T. AAPl reversed right at the 78% fib resistance line and if this bearish Gartley pattern is going to play out, it may be in the very beginning stages of a larger drop here.
= = =
If you would like to see the top 5 patterns to trade from, click here for the full free tutorial.

