Last week’s Hybrid Lindsay forecast didn’t work near as well as the previous week’s forecast which called for a high on 4/21/14 (the high of the first rally from 4/11/14 occurred on 4/22/14). Last week I was expecting a low near Thursday or Friday and that clearly didn’t happen. I’m still going to claim “partial credit” however as I remain convinced of the existence of an inflection point in the Dow late last week (or possibly as late as today).
In hindsight, the key should have been a small (but perfect) ascending Middle Section which forecast a high last Friday (Figure 1). While I did see it, I mistakenly ignored it due to the fact that it was not centered on the low of either a basic cycle or multiple cycle (for more on Lindsay cycles, download a free copy of An Introduction to Lindsay at Seattle Technical Advisors).
In Figure 1, point E (the default measuring point) counts 88 days to the turning point, the closing low on 2/3/14. Counting forward 88 days from the turning point generates a forecast for a top last Friday. At this point, Friday is the intra-day high of the April rally. I believe we have seen the end of the rally from 4/11/14.
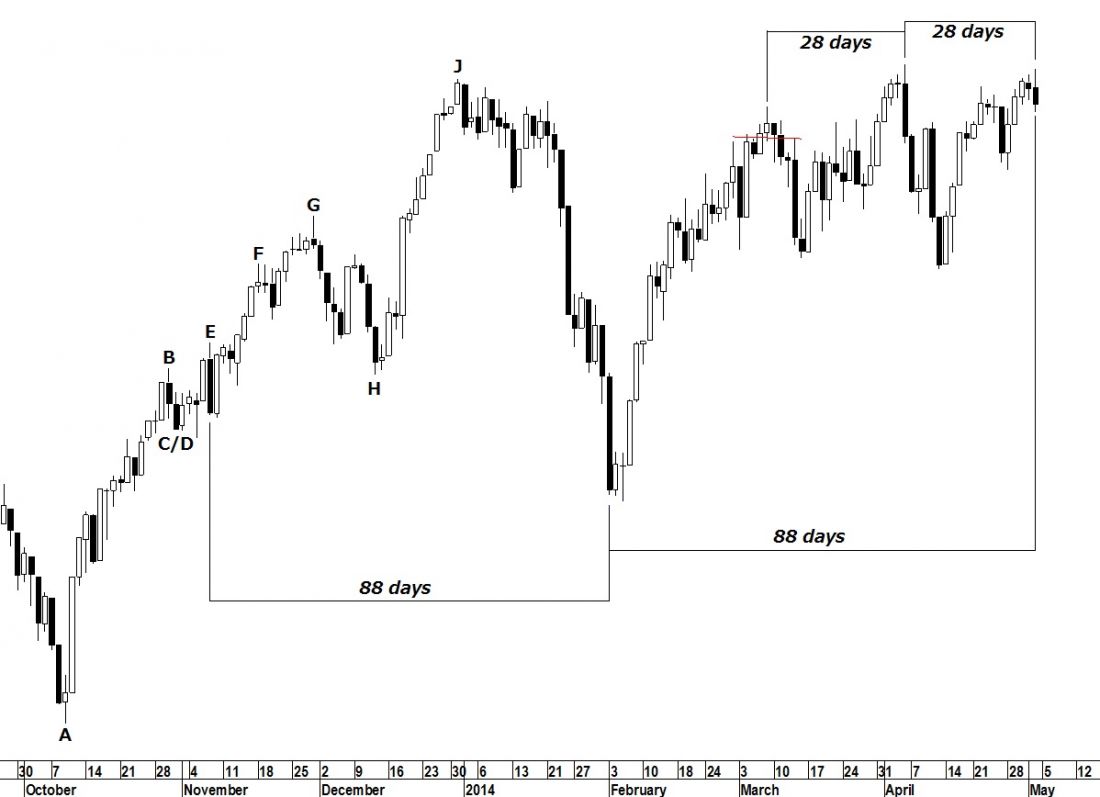
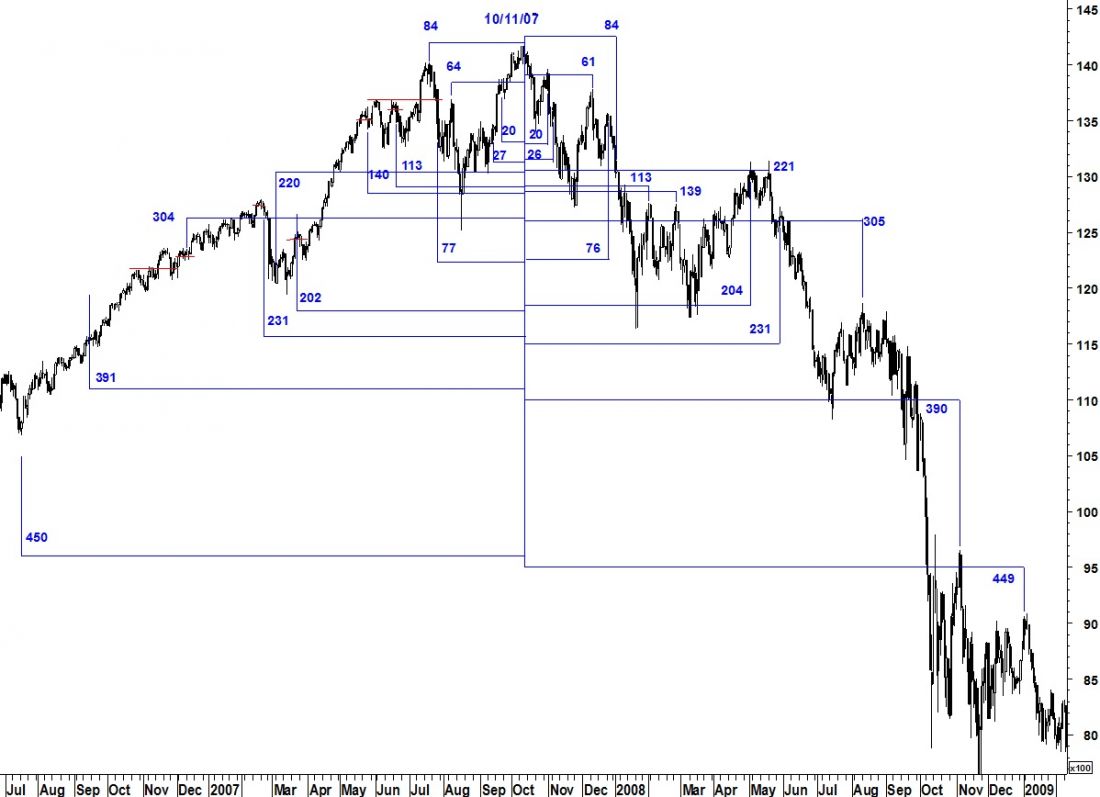
Another reason to believe the April rally ended last Friday is the 28-day forecast in Figure 1 above. In this case, we are counting from the high of a flattened top on 3/7/14 to the high of what I believe was the end of the bull market on 4/4/14. That interval is 28 days. 28 days beyond 4/4/14 was last Friday. This is an approach which works well (but is not a stand-alone method) when forecasting reaction highs during the first basic decline in a terminal decline. A terminal decline comes after the top of a bull market. Figure 2 below shows how it worked forecasting those reaction highs after the bull market top in October 2007.