

Last week we wrote about the “wall of worry” markets climb as they make new highs. This week we are changing our perspective a little, and we are coming to a sobering conclusion; it looks like it is time for the bulls to bail out.
The upside potential is no longer big enough to justify the downside risk, and prudent investors should watch this one from the sidelines for a while.
Overall, we are still long-term bulls. The fundamental driving force of this market is the Federal Reserve and its easy money policies. We think those policies will continue, if for no other reason than to avoid the devastation that will follow when they stop.
But while the free money keeps on flowing, the impact on the market – the ability to levitate asset prices – is slowing down. It just isn’t as effective as it used to be.
As a result the upside potential is limited, while the downside has much more room to move; any rational risk-reward calculation says you should forgo the small gains that may be available to avoid the much greater risks.
HERE IS WHAT WE’RE THINKING
We have already made a major run up; about 220 points from the June low, and a remarkable 130 points in four weeks from the October low around 1640. Nothing goes up forever, and the longer the rally lasts, the closer it is to the end.
Recent market developments are also unsettling.
• The volume is drying up; Monday Nov 4 was especially low.
• New money is coming into the market, attracted by the highly favorable seasonal bias – November, December and January are historically the best three consecutive months of the year – but the price is struggling to regain the previous highs. It looks like the earlier longs are cashing out.
• Investor sentiment is especially bullish, The AAII survey – the so-called dumb money – is 45% bullish, only 22% bearish; sentiment indicators, while they are down from recent highs, are still elevated.
• Market indicators for the short-term are extremely overbought. When all the buyers are already all in, who is left to push the price higher?
WHAT HAPPENS NEXT
Some months ago we were calling 1750 – 1780 as the top area for this phase of the market. That’s the top boundary of the up-trend channel. Each time it was touched in the past, a significant retracement followed. We’re there now.
There may be an attempt to retest the up-trend line. But if there is, a pullback is the most likely outcome. The test of the pullback will be around 1750.
We think the October close at 1751 will be the line to watch. If we start seeing prices drop below that level, especially closing below that level, we can expect some serious profit taking and a run at the recent buyers’ stops.
The next minor support is 1742-44; the major support is 1710-1705.
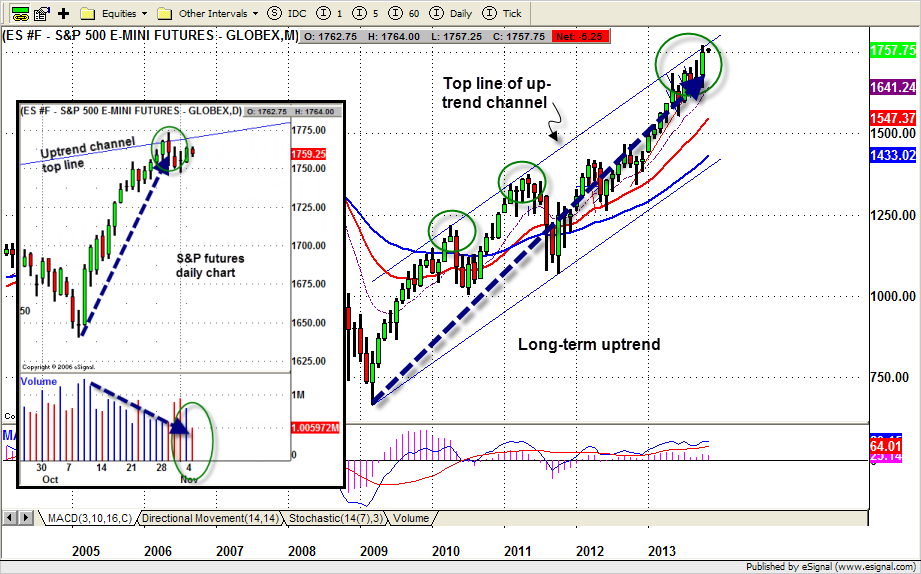
Chart: S&P 500 e-mini futures, continuous contract
= = =
Polly Dampier gives active traders real-time market guidance at www.naturus.com

