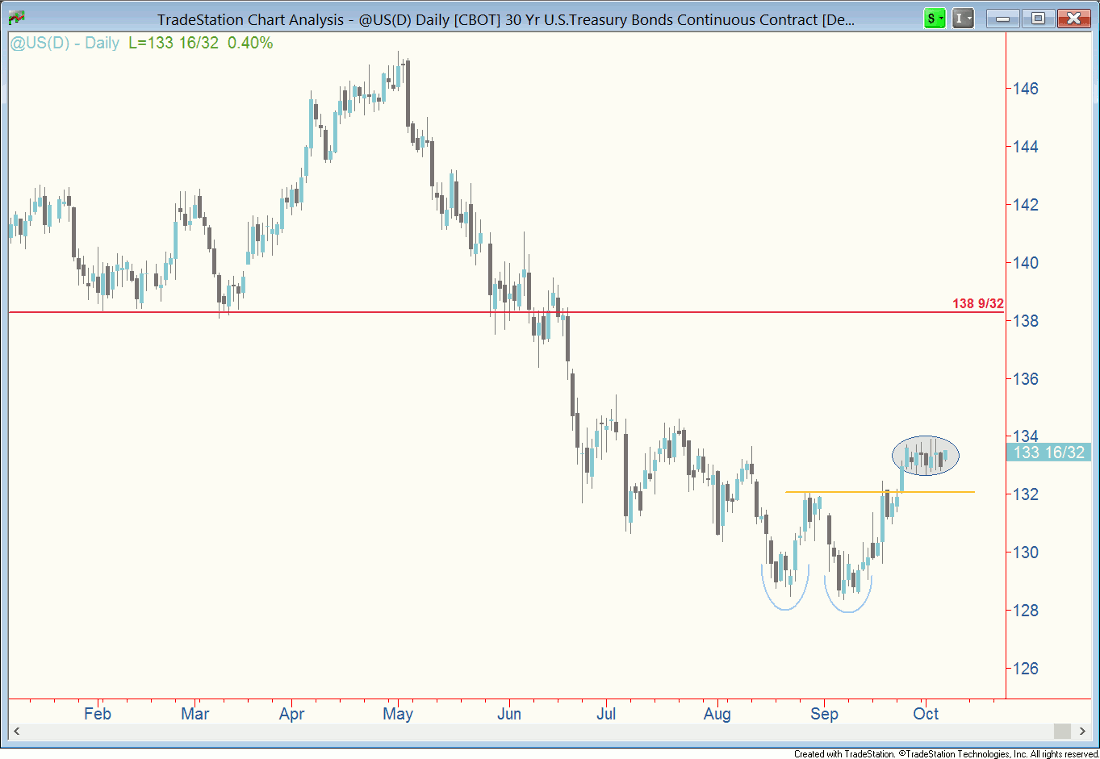
The 30-year Treasury bond futures contract shows the type of bullish price structure you’d expect to see in a technical analysis textbook. Two lows in August and September resulted in a bullish double bottom formation. Price broke out in late September by clearing the intervening high (orange line). Shortly after the breakout, price began to trace out a second-stage base in the form of a platform, or range. The next major layer of chart resistance is 138 9/32, pointing to substantial upside potential from the current 133 13/32.

I’ve had position trader clients at miAnalysis long TLT (iShares 20+Year Treasury Bond Fund) since 9/18 – the day the Fed announced it wouldn’t taper its monthly asset purchases, and after momentum had been improving since June. The recent range presents an attractive secondary buy point. What I like most about ranges is that you know quickly when you’re wrong – if price breaches the range – so you can keep risk to a minimum.
Additionally, right now, TLT provides an attractive way to hedge risk in stock ETF positions amid the ongoing partial shutdown of the U.S. government and the possibility of the country defaulting on debt obligations. Have a good week, everyone. Best, Chris.


