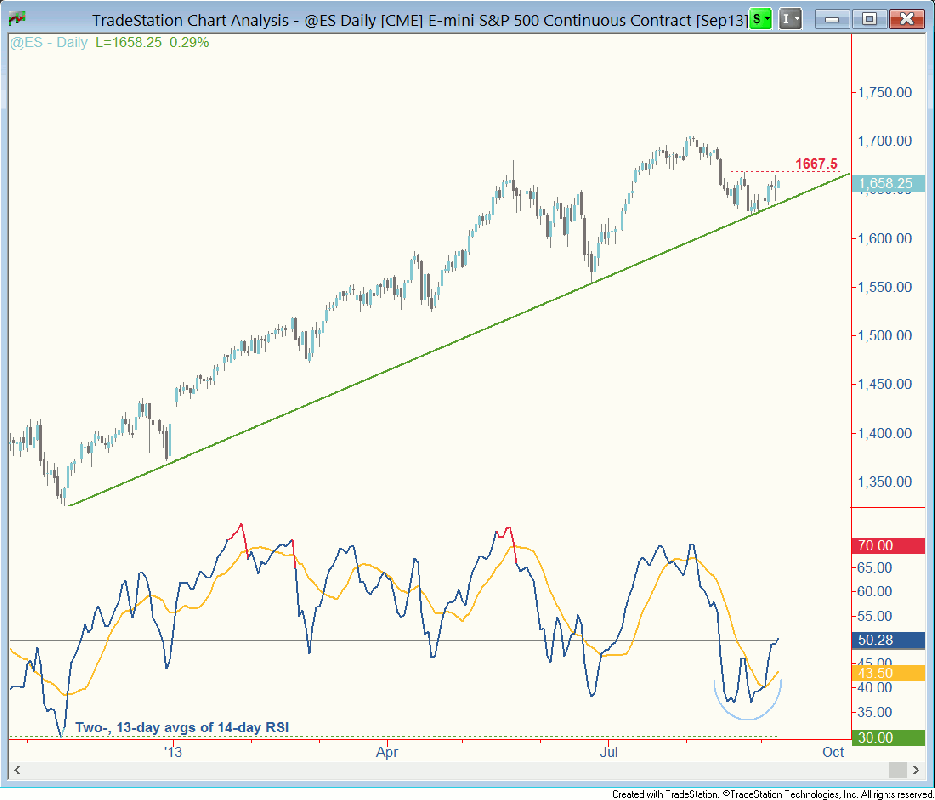
My stance at mianalysis since the week of August 23rd has been that position traders should buy the dip in the S&P 500 after the index reverted to its weekly mean at the 20-week simple moving average. The bullish price action in the S&P 500 E-mini (ES) supports that stance. Although the crowd hemmed and hawed in the wake of Friday’s release of the August labor report, I don’t see any challenge to the bullish price structure.
CHART ACTION
ES confirmed technical support at the bullish trendline drawn off the November low, and appears to be forming a base around that floor that would support a rise in the near term (approximately two to 12 weeks). Price needs to clear a small ceiling at 1667.5 to confirm a breakout from the base. Concurrently, the fast RSI average traced out a bullish double bottom formation and broke out, a very bullish sign for the market.

DON’T BE GREEDY
Position traders can consider placing stops beneath the trendline. I would advise not being too greedy on the long side of the market. Weekly momentum (not shown here) has been slowing since May.
Based on the tendency for momentum to lead price, there’s a good chance the market is getting closer to the beginning of a correction. So, if the market indeed recovers, we may be looking at the last push higher before the tide goes back out.
= = =
What do you think on the strength of the equity uptrend? Are stocks vulnerable near term? Post a comment below.


