I use pivot point analysis for support and resistance targets. Pivot points are the only predictive indicator that shows me where to look for buyers (support) and sellers (resistance). Day traders use daily and weekly pivots while swing traders/investors use monthly and yearly pivots.
YEARLY PIVOT POINTS NEARBY
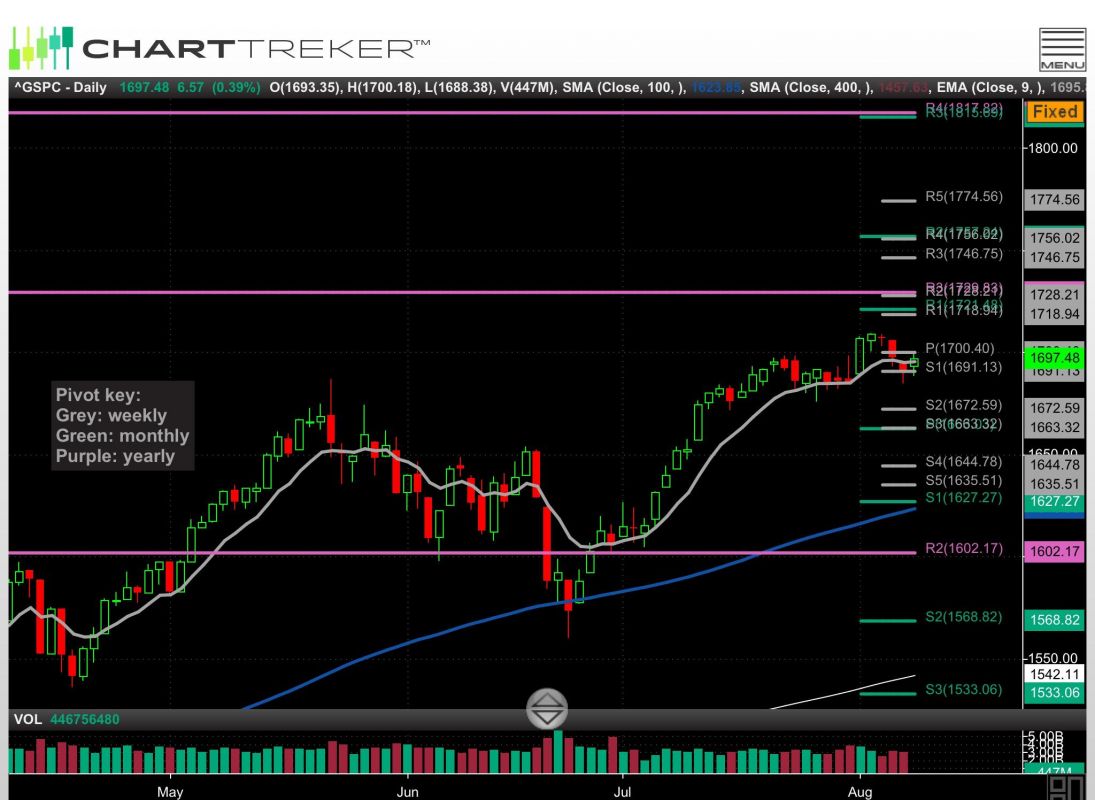
The Dow Jones 2013 yearly R3 pivot (15,570) has been resistance now for a few months. The S&P 500 (SPX) is close to its yearly R3 pivot point at 1,730 (see Figure 1 below).
The NDX (QQQ) is also close to its yearly R2 pivot point at 3,186. We are close to the next yearly resistance levels on the indexes.
BACKTESTING RESULTS
I’m not saying this will be the top for 2013. In back testing the S&P 500 since 1970, it has gone to the yearly R3 pivot point only five times in 42 years. In those five years, four times it went on to the yearly R4 pivot. Only once (in 2006) was the yearly R3 pivot point the high for the year. We could go up to the yearly R4 pivots. They are 16,200 on Dow Jones, 1,818 on S&P and 3,495 on NDX.
HISTORY SHOWS
In the past 42 years, since 1970, the yearly R4 pivot has been hit only four times, and three of the four times it was the high of the year (’80, ’87, ’89). 1995 was the only year the S&P 500 and Dow Jones went higher than the yearly R4 pivot points.