

The 20-year Treasury bond holder (TLT) has been declining since it made a high at 132.21 a bit more than a year ago, and some analysts have been urging long-term investors to get back in on the long side. The fundamentals, they say, make the long bond look cheap at these levels.
We use technical analysis for our trading decisions, and while the fundamentals may say go, go, go, the technicals say wait a minute. This is what we see.
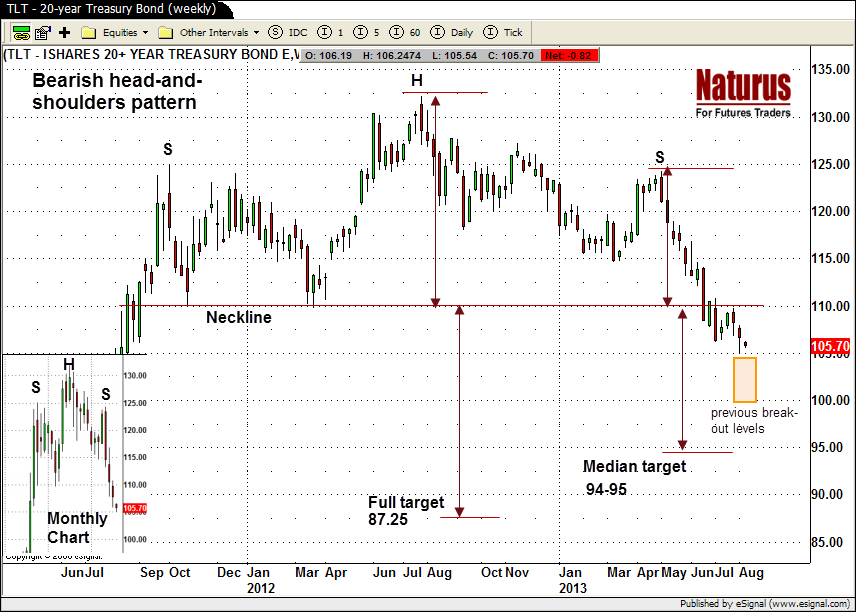
Figure 1: TLT 20-year bond, weekly chart
The chart – especially the monthly chart (inset) – shows a very clear head-and-shoulders pattern, which is a bearish pattern. The neckline of this pattern (the line drawn across the lows of each shoulder) is around 110.00 and it has clearly been broken.
Normally a broken neckline presages a further decline. The downside targets are usually calculated as the same distance below the neckline as the distance from the head to the neckline; or alternatively, as far below the neckline as the distance from the right shoulder to the neckline.
THE TARGETS
By those measures, the bond has further to fall—down to 87.25 for the full target—down to 94-95 for the smaller target.
In addition there are a series of important support levels just below the current price, 105.70. The area from 104 to 100 has been the breakout point for rallies dating back to 2008. In particular there is an unfilled gap from 2011 at 102.33 that is probably the last best hope for investors looking for a reversal of the current downtrend.
We’re going to wait and see if that support holds before we consider a long-side entry. If it fails to hold, we’ll be looking for more declines toward our target levels.
= = =
Polly Dampier is the brains behind Naturus.com, a subscription service for active futures traders. Learn more here.

