
The e-mini S&P stock index futures (ES) bulls are fading from a technical perspective. Prices have been trending lower for three weeks, since the all-time high was scored in mid-May. Also, Japan’s Nikkei stock index is in bear territory after dropping 6% on Thursday and is now down over 20% from last month’s high. The world market place continues to fret about the major central banks of the world taking away the easy-money punch bowl from the party. This week has seen heightened risk aversion in the worldwide market place, and that’s also bearish for the stock market. Savvy traders and investors are now seriously worried that the bear market in Japan’s equities will soon spill over into the same for the U.S. stock market.
The U.S. stock indexes are extra important markets that impact many other markets on a daily basis. My friend and respected industry professional Louis Mendelsohn has been studying “Intermarket analysis” for decades.
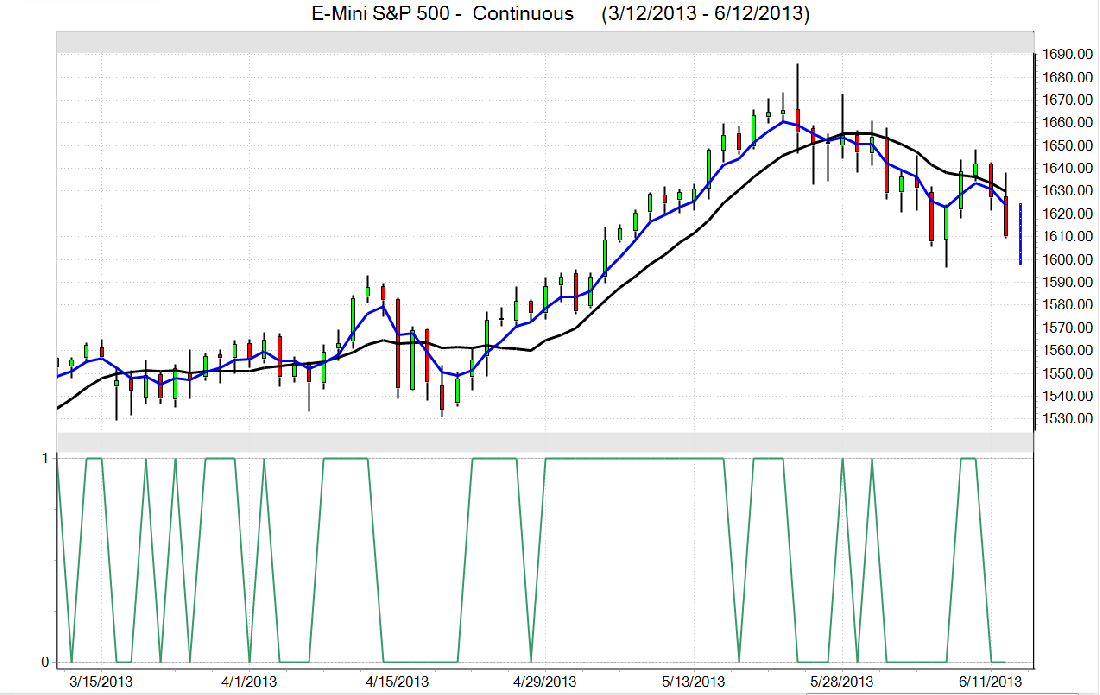
From an important Intermarket analysis perspective provided by VantagePoint Intermarket Analysis software (www.TraderTech.com), it appears there will be more downside price action in the E-mini S&P futures in the near term.
VantagePoint is a valuable trading tool for which a trader can glean clues on potential near-term price trend changes or continuation of present trends. These near-term clues provided by VantagePoint can and do give a trader a key edge.
See on the VantagePoint daily bar chart for the E-mini S&P futures that the Predicted Medium Term Crossover study shows the blue predicted 4-day exponential moving average is below the actual black 10-day simple moving average close, and both lines are trending lower, which is a near-term bearish signal.
The Predicted Medium Term Crossover is the predicted 4-day exponential moving average of typical prices four days ahead (P4EMA+2) crosses above or below the actual 10-day simple moving average close (A10SMA).
Also see at the bottom of the daily chart for the E-Mini S&P futures that VantagePoint’s Predicted Neural Index (PIndex) is also in a bearish mode, with a reading of 0.00. The PIndex is a proprietary indicator that predicts whether or not a three-day simple moving average of the typical price will be higher or lower two days in the future than it is today. The Predicted Neural Index compares two three-day moving averages to one another – today’s actual three-day moving average with a predicted three-day moving average.
When the predicted simple three-day moving average value of typical prices is greater than today’s actual three-day moving average value, the Predicted Neural Index is “1.00,” indicating that the market is expected to move higher over the next two days. When the predicted simple three-day moving average value of typical prices is less than today’s actual three-day moving average value, the Predicted Neural Index is “0.00,” indicating the market is expected to move lower over the next two days.
The Predicted Neural Index is either correct or incorrect so its performance can be measured in terms of percent correct to produce the accuracy statistics cited for VantagePoint, which has a predictive accuracy rate of around 85% across a wide range of markets and time spans in ongoing research.

