
S&P 500 Cash Index (SPX)
The S&P 500 cash index (SPX) closed at 1485.98 on Friday, up 13.93 points for a net weekly gain about 0.9%.
The stock market spent most of the week in sleep mode until the last two days when we had a gap up, with the market making new highs on Friday. All of the major market indexes achieved milestones: all-time highs for the small-cap and mid-cap sectors, and a new five-year closing high for the DOW.
This week is a short trading week; markets are closed Monday in observance of Martin Luther King Jr. Day. The SPX could be relatively weak in a post- holiday trading week.
Technical analysis
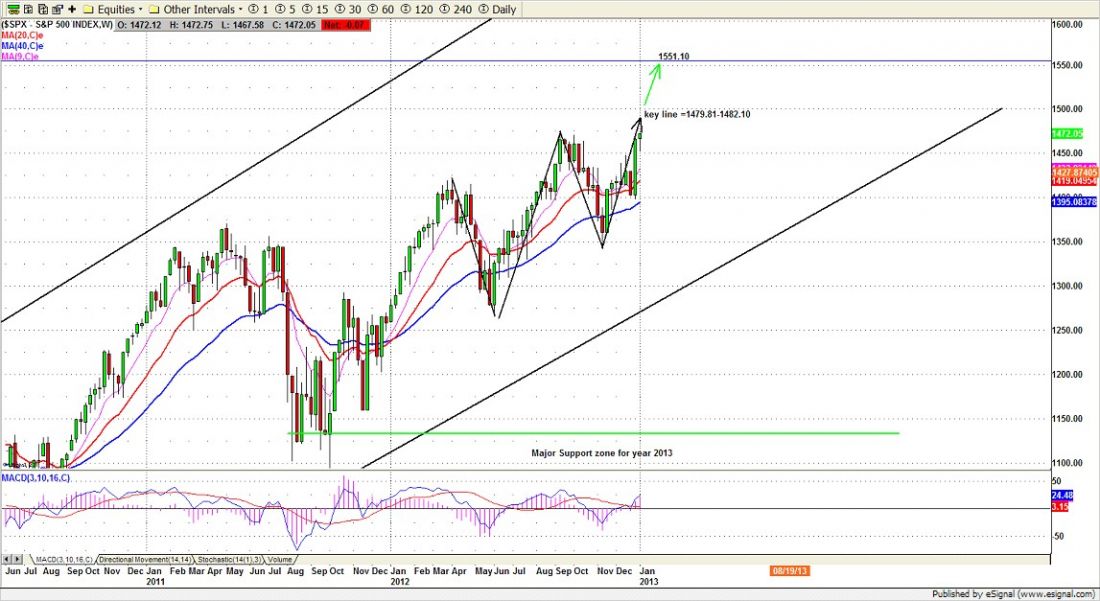
Based on the weekly chart (above), on Friday SP500 broke last year’s high 1474.51 and closed above our key zone 1479.81-1482.10. It gives confirmation that bears are going to throw in the towel. The price is likely to head up to challenge the next round-number resistance at 1500.
Based on wave principles, once SP500 broke the 1474.51 level, it changed the measurement of the major wave 5 and its sub-wave movements. Since the key zone has been breached, it supports moves to new multi-year highs. The SP500 could rally another 7.5 % before going into correction mode.
A move higher should be expected at some point in the future: from here, about 1485, to around 1590-1600 or perhaps just above the October 2007 high in the 1576 area.
The developing chart patterns support a move to a higher level in the future. It seems more and more likely that SPX is going to form a symmetrical pattern overlapping with the Gartley pattern. The symmetrical pattern high should be around 1551.12 and the Gartley pattern high could be around 1498 or the 1511.24 levels, which will be acting as short-term resistance levels.
Overall, the market is bullish. The major trend remains up and will continue bullish. But there are also short-term risks that should be noted:
- All three of the small (900), mid-cap (1000) and big cap (1500) groups are getting ready to do battle with a round-number area simultaneously
- VIX could pop after last week’s option expiration.
- The AAII survey – a contrary indicator – showed 43.94% bullish vs 27.32% bearish last week.
All of those could lead to a price pullback. But the pullback will be short lived. The continued short covering and retail flows into equity markets will be supportive in the weeks ahead.
Monthly resistance 1500 and support 1405; Weekly resistance 1500 and support 1456
To see the complete analysis of the S&P Futures market and the outlook for gold, oil, bonds and the Euro, visit this link (registration required):
http://www.naturus.com/registered-users/weekly-market-preview.html

