
S&P 500 forming topping patterns
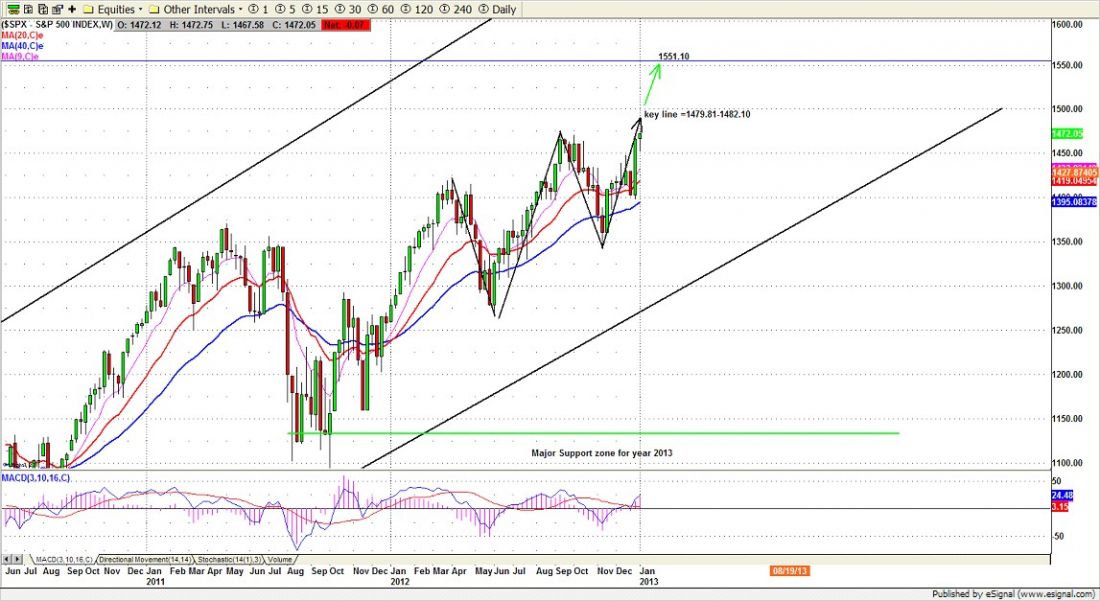
SPX Weekly Chart
The S&P 500 cash index (SPX) closed at 1472.05 on Friday, a small net gain of 5.58 points for the week.
The stock markets clambered to a positive finish last week. But we are sceptical, and tewchical patterns look like a top forming.
In addition, option expiration this week will make the market choppy. Trade cautiously.
Technical analysis
Based on the weekly chart (below), SPX$ is near last year’s high 1474.51 level, but has not yet broken through it. It formed the narrowest weekly range for the past seven weeks (NRW7) last week, giving us a warning signal that the storm is coming soon.
Based on wave principles, the 1474.51 level remains a major wave 5 top area. The SPX could have a fake breakout and reverse from there to start its correction.
Based on pattern movement, it has become quite clear that SPX is forming either a bearish symmetrical pattern or Gartley pattern. It doesn’t much matter which; both are bearish for the next movement.
The bearish symmetrical pattern or Gartley pattern will look more likely if price continues to hold up last week’s low.
The bearish symmetrical pattern high should be around 1551.12 and the Gartley pattern high could be around 1498 or 1511.24 level. We will not be surprised if there is a sell-off from those resistance levels.
For option expiration, the option battlefield is near the 1475 line. Bulls will fight for a move to 1485-1500 and bears will fight for 1450-1445 line.
Monthly resistance 1500 and support 1405; Weekly resistance 1490 and support 1445.
To see the detailed Naturus analysis for the week of Jan. 14, visit http://www.naturus.com/registered-users/weekly-market-preview.html Free registration required.

