

There’s just nothing quite like a perfect support and resistance (‘S/R’) pattern, regardless of how it is formed or what it is based on. I truly live for finding them anyway I can, and thus have spent many a month developing diverse ways to do this.
BIG PICTURE
Today’s menu presents such S/R patterns on a long-term gold monthly chart, with two logical observations to address the following questions: Firstly, is this really the start of a new uptrend, or is there another major drop coming, with a lower low ahead, like in ’08? And secondly, if another uptrend is upon us, where is it going to?
BLENDING METHODS
To generate answers, I will blend two techniques. One is traditional Gann, and the other, well, not-so-traditional:
1. Generating ‘angles’ from zero, directly underneath an important reversal: in this case the very important major low of Aug 1976 ($101.50).
2. Directly converting degrees of an important geometric angle into 1×1 price per time relationship: specifically the 90o of a right angle into 90 cents per month, or ‘$.90/M’. (Also $90/M /100.) Additional angles are formed by multiplying this ratio by whole numbers. (Hint: Try Fib ratios etc. too. Experiment….)
Bulls enjoy, bears beware:

THE ANGLES ARE IMPORTANT
The first chart clearly defines 2012 support at the 4×1 angle as being sequential with the extremely major low area of Aug ’99 – Apr ’01 directly on the 1×1 angle (two adjacent blue arrows) and the major low of ’08 on the 2×1 angle: 1×1, 2×1, and 4×1, a nice doubling series emerging. (Notice that all angles when expressed as price/time are also important quarterly divisions of 360o, since 90o is 1/4th of a circle.)
Ok, so this analysis does connect this year’s support with the previous two major areas, which answers the first question: Yes, the correction is over and a new bull run is starting from ‘harmonic’ (related) support from the 4×1 line.
WHAT’S NEXT?
Now for the next question: Where is it going?
Pattern two, please (this is when I cheer from my seat):
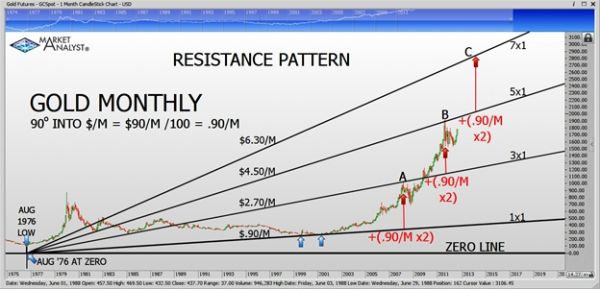
Here, the odd numbers have it, steadily increasing the price/time ratio by $1.80/M (180o). Tops of ‘o8 (A) and the all-time high (B) are caught ‘red-handed’ by 3×1 and 5×1 respectively. The next in this odd series is the 7×1 angle. If gold continues its over-all parabolic ascent, a general area of $2800-$3000 is clearly in order, hence the title of this article. This price range is in early-mid 2014 on the 7×1 angle.
TAKING IT ONE MORE STEP
And just for the extra-curious, here’s a look at all these lines (and more) put together, but from the perspective of the 5×1 angle of $4.50/M, as in 45o x10. (The purple angle segments of 3/7 and 4/7 at points G & H are divisions of $3.60/M (360o), and are $1.54/M and $205.71/M respectively.) All-in-all, there are14 points of reversals, with some higher angles left out for clarity.
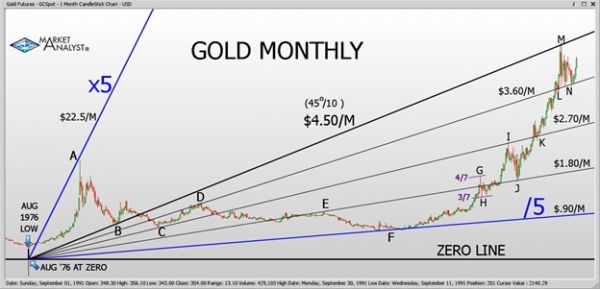
Notice that the previous all-time high of ’80 (A) is at exactly x5 of this 5×1 angle (25 x1, or $22.50/M), and naturally the 1×1 $.90/M angle support is seen as /5. Perfect balance of extremes, wouldn’t ‘ya say? We are possibly about to cross over the median.
On the cautious side, naturally, a sustained break below support would indicate a break of the overall pattern, and suggest that the massive 13 year uptrend is at an end.
= = =
Read our daily Markets section for specific trading ideas.

