We have argued that this is the right time and right place for a ‘cyclical pivot’ to occur. A ‘cyclical pivot’ represents a trend change within the markets that favors economically sensitive sectors while at the same time pulling bond prices lower. In recent years these kinds of trend have tended to last for about twelve months.
There is a reasonable chance that in a few months we will be able to look back and ‘date’ the start of the pivot as late July.
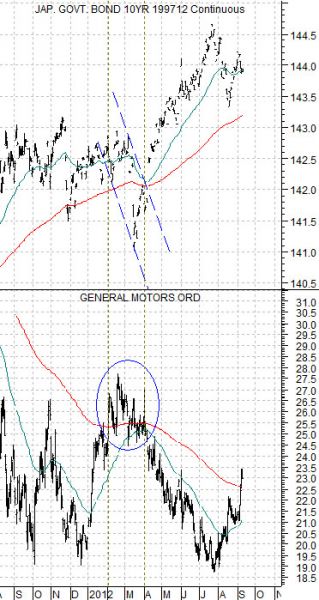
Below is a rather messy chart comparison between General Motors (GM) and the Japanese 10-year (JGB) bond futures. The JGBs trend in the same direction as long-term Treasuries.
GM returned to the markets around the start of 2011 so the 200-day exponential moving average line does not show up until September of that year. While this may be a somewhat ‘small sample size’ there are a couple of details that warrant discussion.
The bottom for GM in late July lines up with the peak for Japanese bond futures. As long as GM is trending lower the offset should be a positive trend for long-term bonds. A ‘cyclical pivot’ would include strength in GM and weakness in bond prices. The chart makes the case that this may have begun about a month and half ago.
When GM trades above its 200-day e.m.a. line there is downward pressure on bond prices. In fact we will argue that GM above its moving average line should go with the Japanese bond futures trading below their line.
This is essentially what transpired at the start of 2012 as GM pushed above 25.50. The stock held the moving average line- more or less- into April. The Japanese bond futures cracked down below their moving average line in March before reversing back above the line at the beginning of April. As soon the JGBs moved up through the line GM’s share price turned bearish as the stock worked down from around 27 to the recent low close to 19.
The point? GM is, for the time being, above its moving average line which means that the pressure on long-term bond prices is building.
First… in a cyclical pivot we like the ‘autos and airlines’ and Japan themes. We were encouraged earlier this week by the reception given to Japan Airlines (a nice combination of both themes) as it returned to the public markets in the biggest IPO since FaceBook. The stock was quoted about 7% higher in the grey market yesterday. Not Netscape or Lululemon but not that bad either.
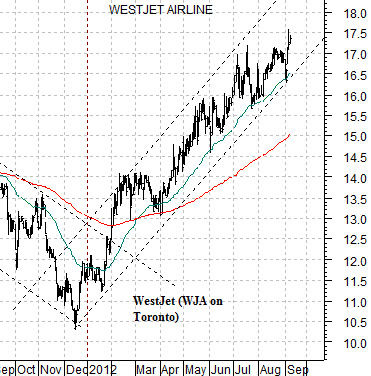
Below is a chart of Canadian airline WestJet (WJA on Toronto). We have been writing about and showing WJA for quite some time so we thought we would run it once again… just because.
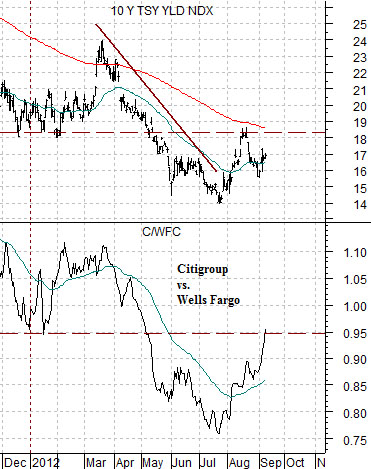
Below is a comparison between 10-year Treasury yields and the ratio between Citigroup (C) and Wells Fargo (WFC).
C represents a ‘lagging’ bank while WFC is supposed to be a leader. The ratio should decline into the bottom of the cyclical trough and then turn higher at the cyclical pivot. As the ratio moves higher with Citigroup outperforming Wells Fargo upward pressure should be exerted on long-term yields.
The point? This looks about right. The ratio has obviously shown strength for a few months at a time in the recent past without altering the trend but our view is that this is the right time and place for a pivot and the markets seem to be at least making an effort not to make us look completely foolish in this regard.
Autos and airlines. Lagging banks. Japan. In a sense this would represent a trend quite similar to the early 1980’s following the commodity price-driven trend through much of the 1970’s.
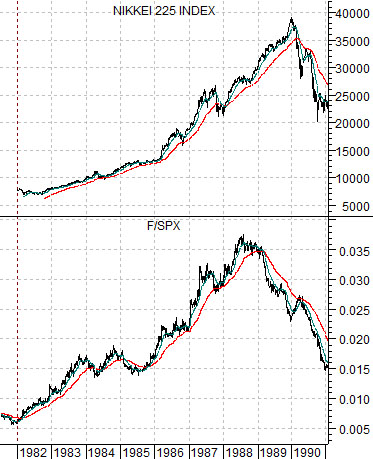
Below is a comparative view of the Nikkei 225 Index from Japan and the ratio between Ford (F) and the S&P 500 Index (SPX). The F/SPX ratio led the turn by about a year at the end of 1981 and then turned lower a year ahead of the Nikkei in 1989. The rest of the time the Japanese stock market moved higher within the context of a trend that included rather marked outperformance by the auto stocks. What is good for the autos is likely going to be good for the Nikkei as well.