Each day we set up the charts with the intention of making at least one specific point. Most days we think back on what we have written and wonder how it is that we can get side tracked so easily. It may be that our point or argument was made in some manner or fashion but it is amazing how often we can complete an entire issue without actually addressing the issue that we were using for inspiration.
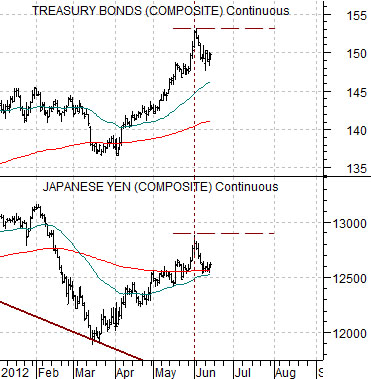
We started off yesterday by showing the first chart below of the U.S. 30-year T-Bond futures and the Japanese yen futures. The argument begins with the idea that the trends are virtually identical. The bond market will rise as long as the yen is moving higher and vice versa.
At the start of a bearish trend a market or security will tend to decline below its 200-day e.m.a. line (red line on chart) and then after the 50-day e.m.a. line has ‘crossed’ to the down side through the 200-day there is typically a counter trend rally back towards the moving average lines. This was, more or less, what we expected to see from the Japanese yen. The link between the yen and the bond market argued that as the yen pushed higher the bond market would rally giving the impression of a deterioration in cyclical growth.
Goodness… we are doing it again. The point today (and yesterday) was supposed to be that there are only 3 things the bond market can do. It can trade higher, lower, or stay relatively flat. Our positive view on large cap U.S. equities- with an emphasis on the defensive sectors- was predicated upon the idea that each of these outcomes could be bullish for prices.
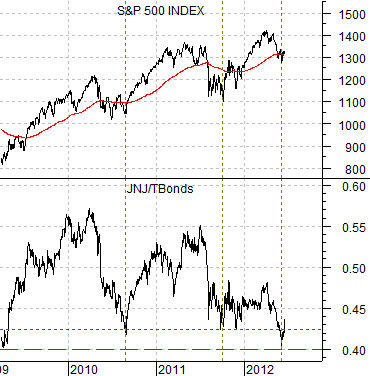
The chart below compares the S&P 500 Index with the ratio between Johnson and Johnson (JNJ) and the U.S. 30-year T-Bond futures.
The JNJ/TBond ratio was ‘low’ enough to argue that it was in the vicinity of a bottom. When the ratio bottoms the SPX tends to bottom. If we view this from the context of the bond market the idea is that rising bond prices simply raise the floor or support under JNJ (and hence the broad market). Flat bond prices would allow money to migrate away from the bond market towards high quality dividend paying stocks while weak bond prices would tend to accelerate the rise in the S&P 500 Index. In other words… once long-term bond prices had risen far enough to provide near-term price support for equities it appeared as if almost any outcome would be viewed as bullish.
Equity/Bond Markets
As Spanish bond yields rise and the markets prepare for post-Greek election volatility we are reminded once again that the news is never as important as the market’s reaction to it.
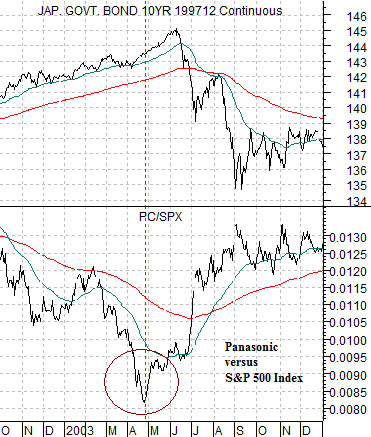
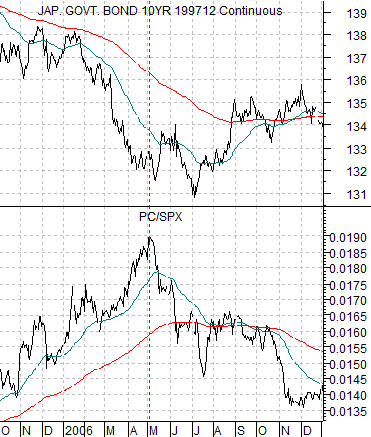
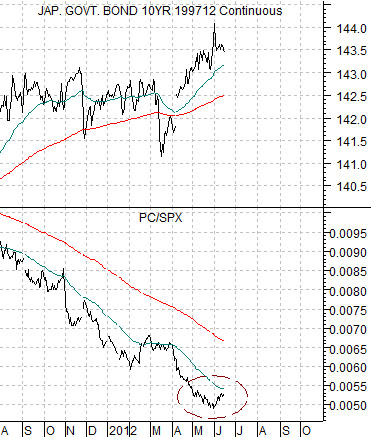
We have included three comparisons between Japan’s 10-year bond futures and the ratio between the share price of Panasonic (PC) and the S&P 500 Index (SPX). The chart below is from 2002- 03, at bottom right is 2005- 06, while directly below is the current situation.
The PC/SPX ratio serves as a rather nice way to follow the trend for long-term Japanese and U.S. interest rates. The ratio bottoms with or ahead of the cycle highs for bond prices and then peaks around the time that bond prices reach a low.
The point is that every time PC starts to outperform the broad U.S. stock market we wonder whether we are finally at some kind of multi-year or, perhaps, generational low for long-term interest rates.
In 2003 the ratio bottomed in late April with the Japanese bond futures moving to a peak into June. The rebound in the ratio marked the start of rising long-term yields as it preceded the first Fed rate hike by more than a year.
In 2006 the ratio turned lower in May with bond prices hitting a bottom at the end of June. Roughly a year later the Fed was forced to cut the funds rate.
Obviously the PC/SPX ratio has not made a clear bottom but with the last two pivots taking place during the second quarters of 2003 and 2006 we admit to being somewhat intrigued by even the most marginal signs of strength. In fact, if the ratio were to snap up through its 200-day e.m.a. line we might be inclined to argue that long-term bond prices were set to turn lower with the first Fed rate hike due towards the middle of next year.