Would the markets really do the same thing three times in a row? Our view is that when something becomes this obvious it is time to look for a different outcome.
NEW YORK, May 22 (Reuters) – Financial and housing shares nudged Wall Street higher on Tuesday after U.S. existing home sales rose in April to their highest rate in nearly two years, but gains were capped by investors’ concerns about the global economic outlook.
One of our views has been that if you expect U.S. home prices to rise… buy real estate. If, on the other hand, you expect prices to stabilize then it makes more sense to buy the banks. And by ‘the banks’ we are referring to Wells Fargo (WFC).
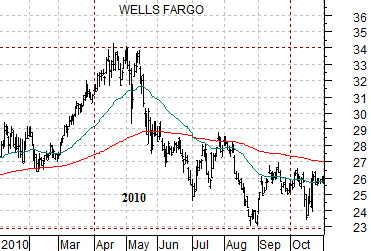
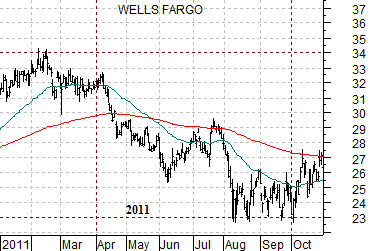
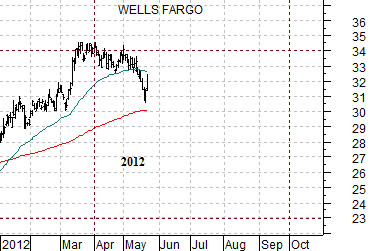
Just below are three charts of Wells Fargo. The top chart runs from January through October in 2010, the middle chart from January through October in 2011, while the lower chart begins in January of this year.
In 2010 the share price of WFC peaked around 34 early in the second quarter only to decline back to 23 through the second quarter. A reasonable trade would have included selling WFC near 34 and then going back to the long side between 23 and 24 during the late summer.
In 2011 WFC peaked around 34 during the first quarter and bottomed in the 23- 24 range in late summer. For the second time in two years being a seller near 34 and buyer under 24 would have been just about perfect.
So… towards the end of the first quarter in 2012 the share price of WFC once again pushed up towards 34. If history were to repeat this would represent an ideal exit point.
Our problem? On the one hand the charts suggest that it makes sense to leave this one alone until some time in August or September. If our learning curve is anything BUT a flat line then we should accept that money is swinging into an out of the markets in six month intervals.
On the other hand… we have a very hard time believing that the markets will do the same thing three years in a row. Twice in a row is possible but the more obvious an outcome appears the lower the odds that it will come about.
Equity/Bond Markets
Wall Street Journal, May 22, 2012: ‘Evidence of a recovery in the housing market has been piling up since last fall, but there has been a good reason to be skeptical of it: Data from the cold months, when housing activity slows, are a less-than-certain gauge of the market’s health.
But now the U.S. is entering the thick of the home building and selling season. And the data continue to flash recovery.’
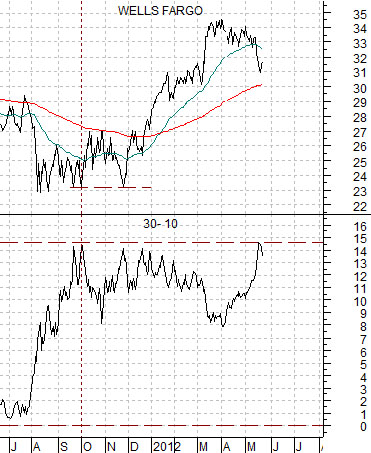
Below is a comparison between Wells Fargo and the price spread between 30-year and 10-year Treasury futures.
The argument is that WFC can be at a bottom as long as the 30-10 spread has reached a top. Given that the spread has recently risen to the peak levels from 2009- 11 this actually seems both possible and reasonable.
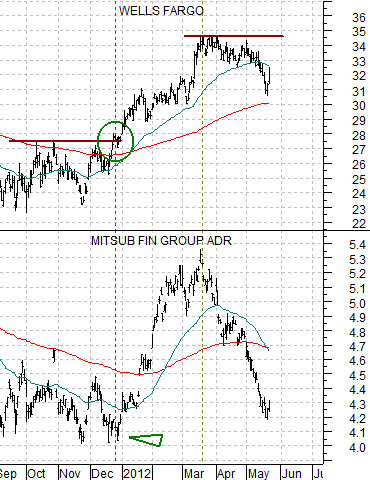
Next is our comparison between Wells Fargo and Japanese bank Mitsubishi UFJ (MTU).
During the final quarter of last year the share price of MTU did not turn upwards until WFC was in the process of making new recovery highs above roughly 27.50. Our thought has been that the laggard banks may remain under a certain amount of pressure until leading financials such as WFC are set to once again make new highs.
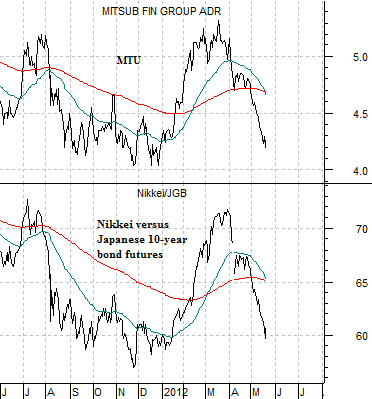
Last is a chart of Mitsubishi UFJ and the ratio between Japan’s Nikkei 225 Index and the Japanese 10-year (JGB) bond futures.
Quickly… the Nikkei only seems to rise when Japanese bond prices are declining. This causes the ratio between the Nikkei and JGBs to ‘whip’ upwards and downwards quite violently. The share price of MTU is almost dead on the Nikkei/JGB ratio. This means that the share price does very nicely when the JGBs are moving lower in price and extremely poorly when bond prices are rising.