Over the first two pages today we are going to make an attempt to paint a couple of pictures with regard to our view on the way the markets are grinding through a variety of trends.
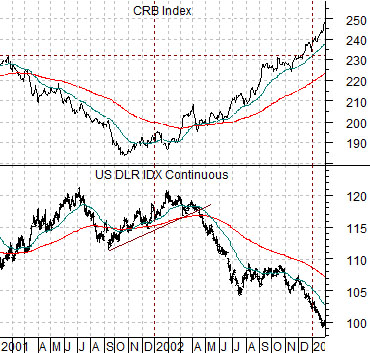
Below is a comparison from 2001 into 2003 between the CRB Index and the U.S. Dollar Index (DXY) futures.
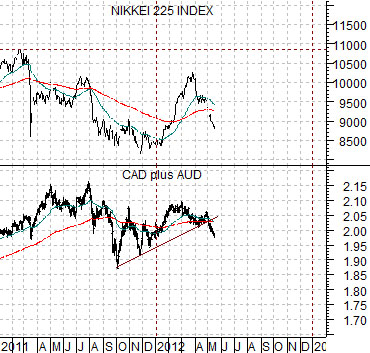
Next is a chart comparison between the Nikkei 225 Index and the sum of the Canadian and Australian (CAD plus AUD) dollar futures from 2011 to the present time frame.
The argument is that we are starting off the current decade with weakness in the commodity currencies in much the same way that the trend from the previous decade was driven by a declining U.S. dollar.
The offset to dollar weakness through 2002 was a bullish trend for commodity prices. The dollar peaked in July of 2001 and then made a second top into the spring of 2002. As money began to flow away from the dollar commodity prices began to rise.
The chart shows that the CRB Index peaked in early 2001 and was above those levels by the end of 2002.
If we use this as a template then we can substitute the combination of the Canadian and Australian dollars for the U.S. Dollar Index. Finding a cyclical market that works as an offset to a declining trend for the commodity currencies is something of a challenge but for today we have settled on Japan’s Nikkei 225 Index.
The idea is that commodity prices do better with a weak dollar while an assortment of themes ranging from health care to tech and Japan to the consumer cyclicals tend to do better with a stronger dollar.
If we take our comparison literally then the sell off in the Nikkei this spring is somewhat similar to the pause that the CRB Index went through between April and June of 2002. The correction is obviously a bit more dramatic but a case can be made that once the markets get used to the idea that downward pressure on the commodity currencies ultimately helps those sectors that ‘use’ raw materials to produce finished goods the trend will improve. In theory the Nikkei could be north of 11,000 as we exit 2012.
Equity/Bond Markets
We were somewhat cavalier with our choice of words yesterday as we called bond markets strength a ‘bear market rally’. In a sense we actually believe that this is true but it might take a considerable amount of hind sight to show why this is so.
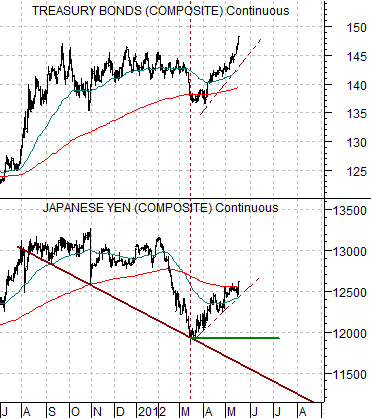
Our view is that the long end of the Treasury market is following the same basic path as the Japanese yen and since we believe that the yen is in a ‘bear market rally’ we extended this over to the bond market.
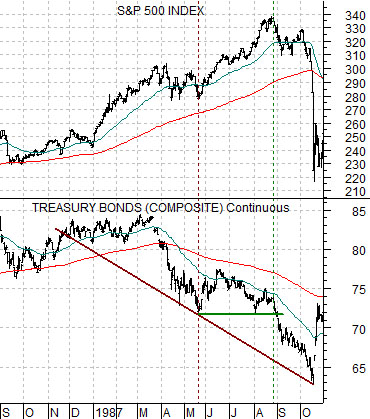
To explain… just below is a chart of the S&P 500 Index and TBond futures from 1986- 87.
The sense is that the TBond futures today are similar to the SPX in 1987 while the Japanese yen today is similar to the TBonds from 1987. Really.
The TBonds declined into May of 1987 before pushing essentially sideways for three months into August. The S&P 500 Index extended its gains until the TBonds finally started to break down towards new lows.
The idea is that the yen is in a declining trend but as it started to bounce in March the bond market started to push upwards. This process will continue until the Japanese yen is ready to swing back to the down side. In other words the strength in the TBond futures today is based on the rally in the yen in the same manner that the bounce in the bond market in 1987 sent the SPX to new highs.
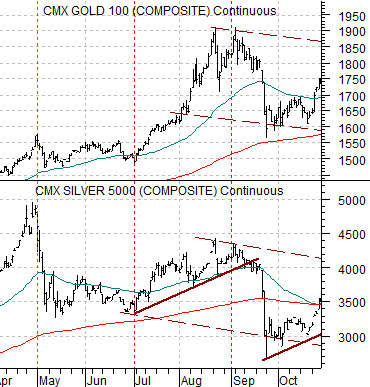
Another perspective is shown below using silver and gold futures from 2011. Notice that silver futures peaked at the end of April and then rallied to a low high through August. As silver futures rallied- within an overall bearish trend- the price of gold moved to new highs. When silver futures weakened in September this marked the cycle peak for gold.
The point? The yen is like silver while the TBonds are like gold. The peak for the bond market will be made when the yen stops pushing higher and once again begins to weaken.