We are going back in time today in search of answers for the days to come. We are, in effect, looking back to help see forward. Or something like that.
Let’s start out with our premise. Crashes and crises do not happen without warning. They tend to be preceded by rather massive capital outflows. A markets crash or crisis is not the cause of capital flows but rather the eventual consequence. In other words, as Warren Buffett once stated, you don’t know who is swimming naked until the tide goes out.
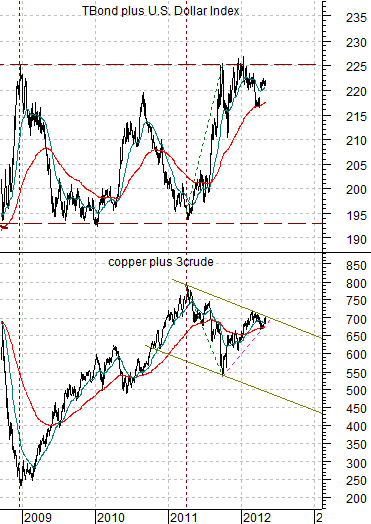
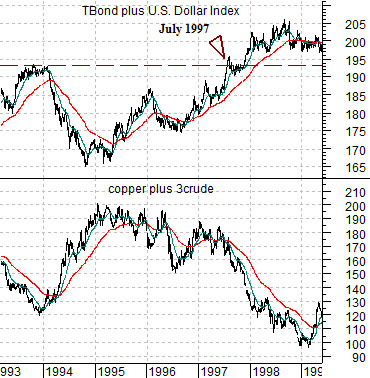
Below is a chart comparison between the sum of the U.S. 30-year T-Bond futures and U.S. Dollar Index (DXY) futures along with the sum of the price of copper (in cents) and crude oil (in dollars times 3).
The argument is that when the dollar and bond market are rising in tandem the offset comes from weaker energy and base metals prices. A trend that includes both dollar and bond market price strength will tend to feed off of declining crude oil and copper prices. The opposite, of course, if also true.
The chart covers the time period from 1993 into 1999 and there are three important dates to keep in mind. First, the dollar and bond market began to rise in early 1995 and while it may seem hard to believe today the stock market did not, in fact, collapse. Second, the sum of the TBond and dollar rose to ‘new highs’ in July of 1997. Third, the trend came to an end in late 1998.
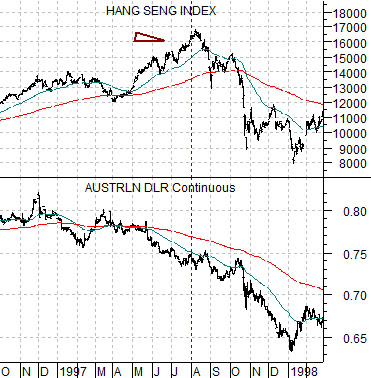
Next is a comparison between Hong Kong’s Hang Seng Index and the Australian dollar futures from 1996 into 1998. The Hang Seng Index ‘crashed’ between August and October of 1997. About a year later the markets were embroiled in 1998’s Asian crisis.
The point is that money started to move towards bonds and dollars in 1995 but the trend for the Hang Seng Index was consistently bullish until… the sum of the TBond and DXY moved above the peak levels of 1993 in late July of 1997. The tide started to go out in 1995 but it was only in 1997 that investors discovered which sectors were ‘swimming naked’. The point became even more clear in 1998 as capital moving away from Asia, Brazil, and Russia created a series of crises that eventually marked the low point for both crude oil and copper futures prices.
Equity/Bond Markets
We are going back in time today in search of answers for the days to come. We are, in effect, looking back to help see forward. Or something like that.
Let’s start out with our premise. Crashes and crises do not happen without warning. They tend to be preceded by rather massive capital outflows. A markets crash or crisis is not the cause of capital flows but rather the eventual consequence. In other words, as Warren Buffett once stated, you don’t know who is swimming naked until the tide goes out.
First below is a chart comparison between the sum of the U.S. 30-year T-Bond futures and U.S. Dollar Index (DXY) futures along with the sum of the price of copper (in cents) and crude oil (in dollars times 3).
The argument is that when the dollar and bond market are rising in tandem the offset comes from weaker energy and base metals prices. A trend that includes both dollar and bond market price strength will tend to feed off of declining crude oil and copper prices. The opposite, of course, if also true.
The chart covers the time period from 1993 into 1999 and there are three important dates to keep in mind. First, the dollar and bond market began to rise in early 1995 and while it may seem hard to believe today the stock market did not, in fact, collapse. Second, the sum of the TBond and dollar rose to ‘new highs’ in July of 1997. Third, the trend came to an end in late 1998.
Next is a comparison between Hong Kong’s Hang Seng Index and the Australian dollar futures from 1996 into 1998. The Hang Seng Index ‘crashed’ between August and October of 1997. About a year later the markets were embroiled in 1998’s Asian crisis.
The point is that money started to move towards bonds and dollars in 1995 but the trend for the Hang Seng Index was consistently bullish until… the sum of the TBond and DXY moved above the peak levels of 1993 in late July of 1997. The tide started to go out in 1995 but it was only in 1997 that investors discovered which sectors were ‘swimming naked’. The point became even more clear in 1998 as capital moving away from Asia, Brazil, and Russia created a series of crises that eventually marked the low point for both crude oil and copper futures prices.