The direction of the flow of money determines the trend. If money is moving towards the commodity currencies then the trend will be dominated by commodity prices. If money is moving towards the smaller currencies then growth will tend to be found in the various nooks and crannies associated with the emerging markets. If, on the other hand, the flow of money is back towards larger currencies like the dollar and euro then we would expect to see better action in the kinds of themes that are generally found in these markets; like health care, tech, and consumer cyclicals.
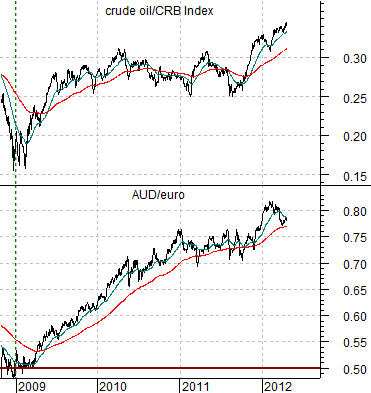
In any event… we start off at top right with a chart comparison between two ratios. The first ratio is of crude oil futures prices compared to the CRB Index. This represents the relative strength of crude oil within the commodity markets. The second ratio is the cross rate between the Australian dollar (AUD) and euro.
The argument is that these are similar trends. The rising crude oil/CRB Index ratio tends to go with money moving towards those countries heavily involved in the production of raw materials. From the start of 2009 to the present day this has gone with strength in the Aussie dollar relative to the euro.
The point is that the forex markets act as the gateways for capital while the flow of capital sets the trend. As long as the Aussie and Canadian dollars remain stronger relative to the euro and U.S. dollar the underlying cyclical trend will remain hostage to the commodities markets.
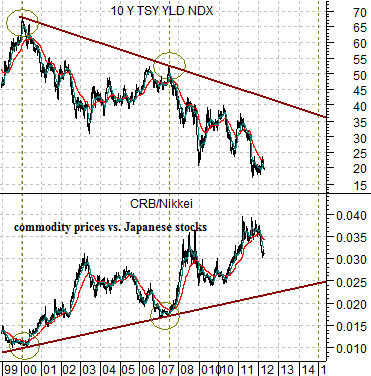
At bottom right is a comparative view of 10-year U.S. Treasury yields and the ratio between the CRB Index and Japan’s Nikkei 225 Index.
This is a curious relationship because it makes a rather clear argument that is not intuitively obvious. One might think that rising commodity prices would put upward pressure on yields but that has not been the case for some time. In fact, when the CRB Index is rising relative to the Japanese stock market… yields have actually declined.
The point here is that we tend to get cyclical peaks at the high point for yields while the high point for yields tends to go with the low point for the CRB Index/Nikkei 225 Index ratio. With this in mind we would argue that one of the focal points for the markets over the next few years should involve some period of time when the Nikkei 225 Index is stronger than virtually all other asset classes and sectors.
Equity/Bond Markets
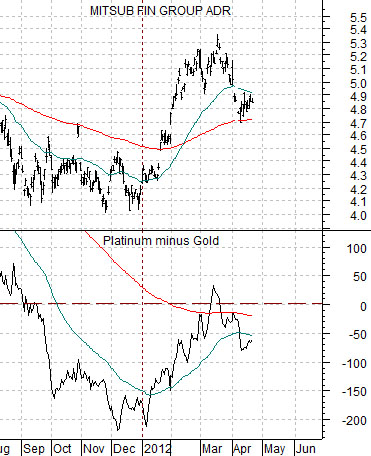
At right is a comparison between Japanese bank Mitsubishi UFJ (MTU) and the price spread between platinum and gold futures.
The quick point is that some combination of platinum price strength of gold price weakness would help push yields higher along with Japanese equities.
So… where are we at present in terms of the bond market. Our view is that the trend for bond prices has been positive for the past 30 years and that prices are at the high end of the trading range.
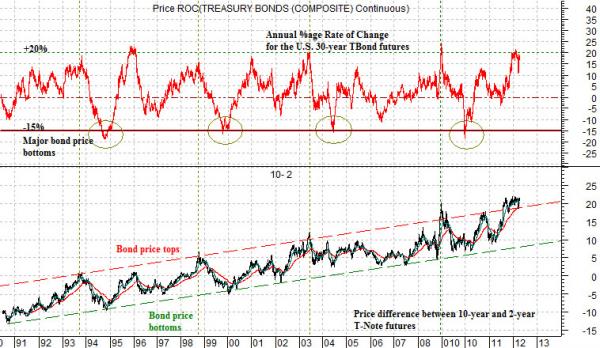
Below right is one of our strange bond market comparisons. The chart shows the price difference between 10-year and 2-year Treasury futures (10- 2) and the year-over-year percentage change for the price of the U.S. 30-year T-Bond futures.
The 10- 2 spread goes with bond prices. It rises as bond prices rise and declines as bond prices decline. From 1990 into 2012 it has made a series of bottoms and tops that create a fairly well defined trading channel. The 10- 2 spread is ‘above’ the trading channel at present in a manner that, in the past, has been associated with bond price tops.
The annual Rate of Change (ROC) for the TBonds has tended to peak around +20% and bottom at or below -15%. At the present time the ROC is at levels associated with bond price tops.
The point here is that bond prices are ‘high’. To get back into a declining trend for bond prices (i.e. rising yields) we would expect to see strength in the Japanese stock market along with weakness in gold prices.