
By FXEmpire.com

Crude Oil Fundamental Analysis April 19, 2012, Forecast
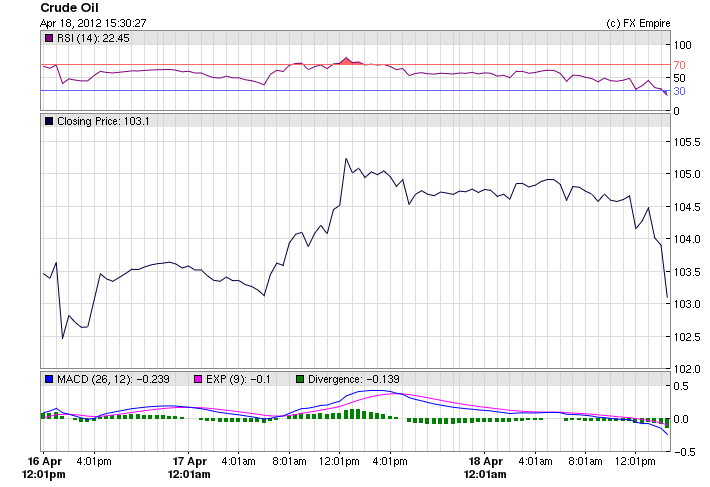
Analysis and Recommendations:
Crude Oil dipped today to trade at 102.99 after inventories revealed a much larger supply then expected or projected by the API earlier this week. Although President Obama’s push to control oil speculation did not cause any price action, it is still worrisome to investors.
Crude-oil dipped after a weekly government report showed inventories higher than expected but a large decrease for gasoline supplies. Crude for May delivery retreated 19 cents, or 0.2%, to $103.99 The Energy Information Administration said crude inventories rose 3.9 million barrels in the week ended April 13. That contrasts with expectations of a rise around 400,000 barrels according to analysts polled by Platts.
Crude oil futures prices were trading above $104/bbl, with gain of more than 0.40 percent in Globex electronic platform. Higher draw down in petroleum stocks in addition to bounce back in equity market is supporting oil futures to trade on positive trend. As per American Petroleum Institute, crude oil inventory have increased by 3000K barrels, whereas petroleum stocks have declined by more than 2000K barrels each. Likewise, as per US energy department, crude oil stocks are also expected to climb up, whereas fall in gasoline and distillates stocks are expected to fall but in a slower pace than prior week. Thus, lower draw down of inventory level may create some pressure during US session.
Economic Events: (GMT)
WEEKLY
-
This Week in Petroleum
Release Schedule: Wednesday @ 1:00 p.m. EST (schedule) -
Gasoline and Diesel Fuel Update
Release Schedule: Monday between 4:00 and 5:00 p.m. EST (schedule) -
Weekly Petroleum Status Report
Release Schedule: The wpsrsummary.pdf, overview.pdf, and Tables 1-14 in CSV and XLS formats, are released to the Web site after 10:30 a.m. (Eastern Time) on Wednesday. All other PDF and HTML files are released to the Web site after 1:00 p.m. (Eastern Time) on Wednesday. Appendix D is produced during the winter heating season, which extends from October through March of each year. For some weeks which include holidays, releases are delayed by one day. (schedule)
Economic Reports for April 18, 2012 actual v. forecast
|
AUD |
MI Leading Index (MoM) |
0.2% |
0.6% |
|
|
EUR |
Current Account |
-1.3B |
5.0B |
3.7B |
|
EUR |
Spanish House Price Index (YoY) |
-7.20% |
-5.90% |
-6.80% |
|
GBP |
Average Earnings Index +Bonus |
1.1% |
1.3% |
1.3% |
|
GBP |
Claimant Count Change |
3.6K |
7.0K |
4.5K |
|
GBP |
MPC Meeting Minutes |
|||
|
GBP |
Unemployment Rate |
8.3% |
8.4% |
8.4% |
|
CHF |
ZEW Expectations |
2.1 |
-8.0 |
0.0 |
|
EUR |
German 2-Year Schatz Auction |
0.140% |
0.310% |
|
|
EUR |
Spanish Trade Balance |
-3.75B |
-3.90B |
-3.65B |
|
USD |
MBA Mortgage Applications |
6.9% |
-2.4% |
|
|
USD |
Crude Oil Inventories |
3.856M |
1.363M |
2.791M |
|
CAD |
BoC Monetary Policy Report |
|||
|
USD |
Gasoline Inventories |
-3.671M |
-0.931M |
-4.277M |
Economic Events scheduled for April 19, 2012 that affect the European and American Markets
14:00:00 EUR Consumer Confidence -19 -20.3
The Consumer Confidence released by the European Commission is a leading index that measures the level of consumer confidence in economic activity. A high level of consumer confidence stimulates economic expansion while a low level drives to economic downturn. A high reading is seen as positive (or bullish) for the EUR, while a low reading is seen as negative (or bearish).
14:00:00 USD Existing Home Sales (MoM) 4.63M 4.59M
The Existing Home Sales, released by the National Association of Realtors provide an estimated value of housing market conditions. As the housing market is considered as a sensitive factor to the US economy, it generates some volatility for the USD. Generally speaking, a high reading is positive for the Dollar, while a low reading is negative.
14:00:00 USD Philadelphia Fed Man 12.2 12.5
The Philadelphia Fed Survey is a spread index of manufacturing conditions (movements of manufacturing) within the Federal Reserve Bank of Philadelphia. This survey, served as an indicator of manufacturing sector trends, is interrelated with the ISM manufacturing Index (Institute for Supply Management) and the index of industrial production. It is also used as a forecast of The ISM Index. Generally, an above-the-expectations reading is seen as positive for the USD.
Originally posted here

