
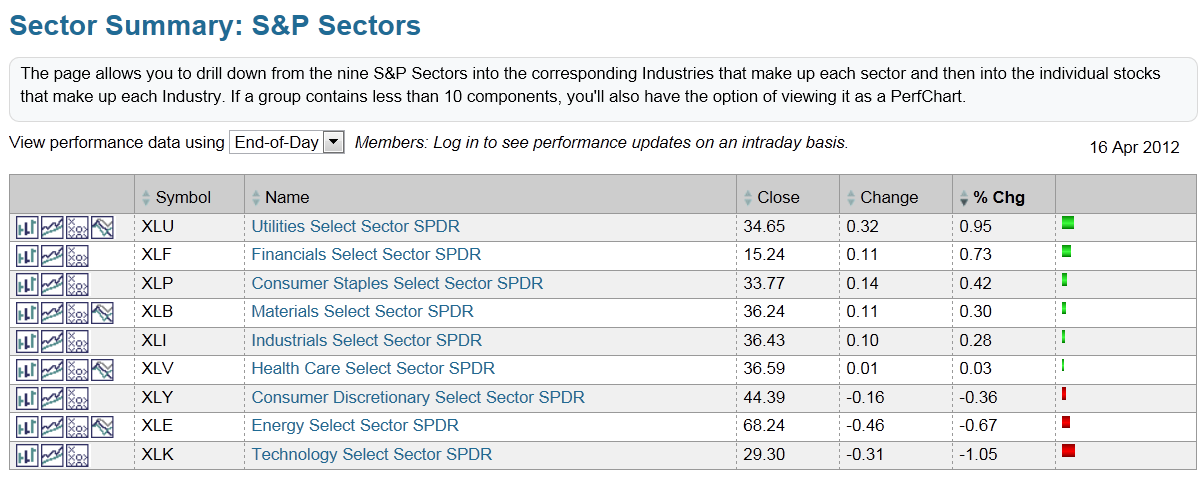
As can be seen on this S&P Sector Summary, the U.S. Financials sector finished in second place today.
The Daily chartgrid below shows these sectors, along with the S&P 500 Index. As can be seen, price is trading around either the 50 sma (red) or the 200 sma (pink).
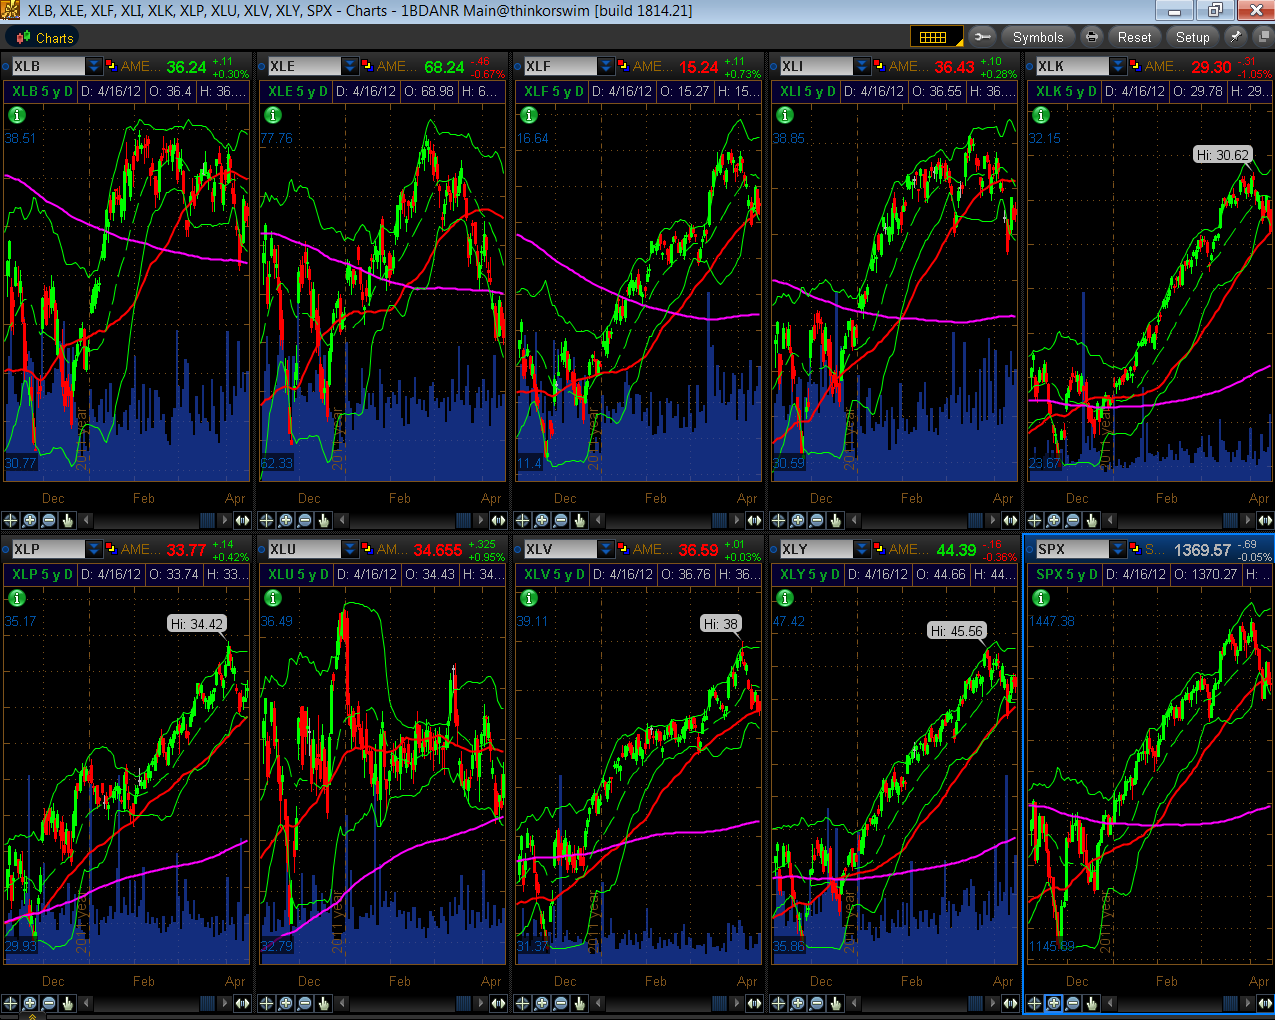
The graph below shows the gains/losses in these sectors since December…

