In yesterday’s issue we commented- somewhat out of the blue- that we were positive on the equity markets but would consider altering that view if the S&P 500 Index rose up to around 1450 by the final week of this month. Or, at least, something similar to that.
We are going to attempt to explain where this particular number ( SPX 1450) and time frame (last week of the first month of a new quarter) came from.
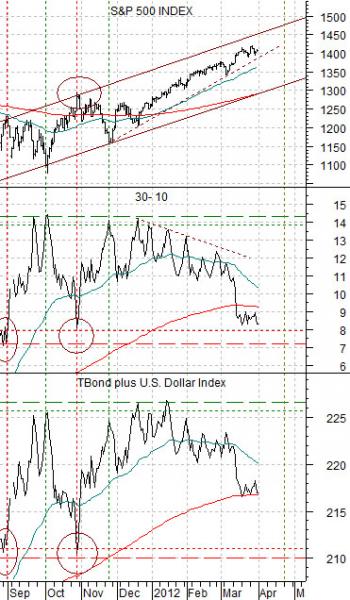
Below is our comparative chart between the S&P 500 Index, the price difference between the 30-year and 10-year Treasury futures (30- 10), and the sum of the price of the U.S. 30-year T-Bond futures and the U.S. Dollar Index (DXY) futures.
The argument is that the equity markets (SPX) have been trending higher in response to a relatively flat bond market and dollar.
The 30- 10 spread goes ‘with’ the bond market so it will rise as bond prices rise and decline when bond prices are moving lower. In recent months this spread has ranged down to around +7 or +8 and up very close to +14. At +14 the price of the 30-year Treasury futures is 14 points higher than that of the 10-year futures.
Through the same time period the sum of the price of the TBond plus the value of the U.S. Dollar Index has ranged from a bottom around 2010 up to a peak just over 225.
The chart of the SPX includes a rising trading channel that is based on the two price peaks at the ends of August and November as well as the lows at the end of September and late November.
The SPX has risen to the channel top when the 30-10 yield spread and sum of the TBonds and DXY have approached the channel bottom. We used a similar argument back in November and December to argue in favor of equities as the 30-10 and TBond plus DXY combinations rose to upper extreme of their respective trading ranges.
IF the SPX were to continue to grind higher this month then it would be approaching the top of the trading channel when it moved into the 1450- 70 range. If this happens to go with trading range lows in the 30-10 price spread and/or sum of the TBonds and U.S. Dollar Index then it would appear to represent a reasonable exit point.
Equity/Bond Markets
So… 1450 for the SPX has now turned into something closer to 1450- 70. With a caveat or two. For good or for bad that is where the number was derived from.
The second point had to do with ‘time’. Specifically the ‘last week’ of this month.
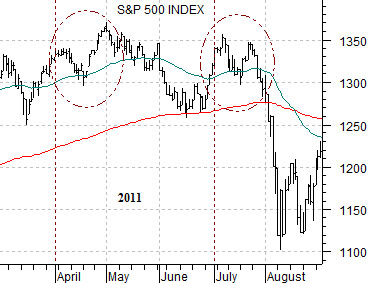
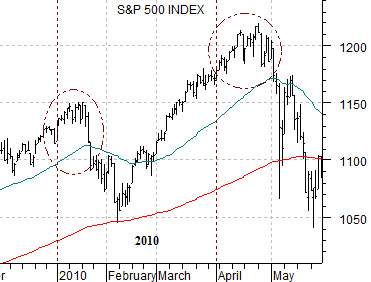
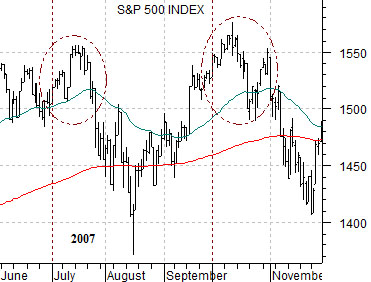
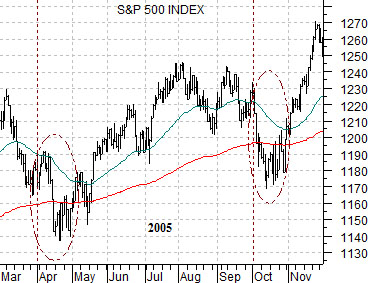
To help explain this view we have included four charts of the S&P 500 Index from previous time periods. The chart below is from 2011, then 2010, followed at bottom right by 2007. Below is a chart of the SPX from 2005.
One of our arguments is that markets often trade quarter to quarter but… the trend change or pivot point tends to be found near the end of the first month of the quarter.
There are any number of explanations for this behavior- including random chance- but we tend to lean towards two fairly reasonable answers. First, markets in motion seem to trend in the same direction through options and/or futures expiry which creates trends that run through the first few weeks of a new quarter. Second, traders often bid the price of stocks higher in anticipation of stronger earnings. The quarterly earnings ‘season’ begins with Alcoa (April 10th this month) and by the final week of the month most of the large cap companies have reported. With the ‘good news’ out of the way the focus of the markets changes from what happened in the previous quarter over to what will happen in the current quarter.
In 2011 (top right) the SPX remained stronger into April before selling off into June. Prices rallied into July and then broke lower into August.
In 2010 the SPX peaked in January and April.
In 2007 the SPX reached a top in July and October.
To show that this actually works both ways we have included a chart of the SPX from 2005 below. The point is that the SPX sold off into the earnings reporting period in April and October before pivoting upwards.
The point? If the SPX continues to climb into the final week of this month and is testing the 1450- 70 range then we will have to seriously consider altering our positive equity markets view at that time.