We were going to do a bit of a spin based on the Ides of March but since March 15th has come and gone it probably isn’t worth the effort.
Stock market ‘crashes’ tend to occur in the second half of the year with a few of the more notable declines taking place in September and October. Our view is that this has something to do with the overlay of the ‘seasonal trend’ which tends to include a cyclical bottom around the month of October and a cyclical top in May or June. Hence… sell in May and go away.
In recent years the month of March has become somewhat more prominent. The U.S. stock market, for example, bottomed and pivoted upwards in March of 2009 while stock prices and long-term yields rose nicely through the first quarter in 2010 and 2011 only to turn back to the down side early in the second quarter.
We thought that we would show an example or three of previous ‘March’s’ that featured some surprising bearish volatility.
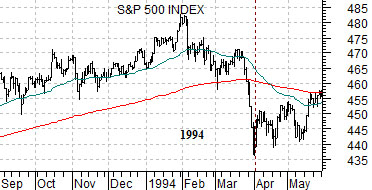
Below is a chart of the S&P 500 Index from 1993- 94. The SPX peaked in early February before staging a mini-crash over the final week or so of the quarter.
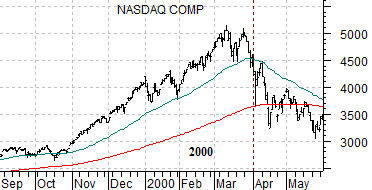
The next chart features the Nasdaq Composite Index from 1999- 2000. The tech and telecom ‘bubble’ felt its first serious crack through the final days of March as the Nasdaq declined rather abruptly from the 5000 level. Much like 1994 the conclusion of the first quarter of the year in 2000 was markedly bearish for equities.
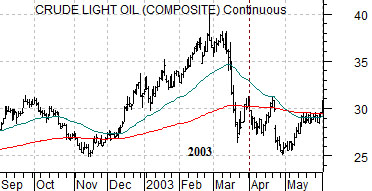
In 2003 the price of crude oil was rising nicely through into the month of March. Days before the U.S. commenced ground action in Iraq the price of crude oil began to plummet. Oil prices fell from around 38 down to 27 over a handful of days through the second half of this month.
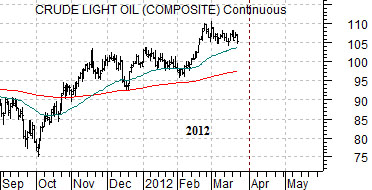
Next is a chart of crude oil futures from the current time frame. Perhaps we should be looking at an equity markets chart but our view is that the conditions have been set for some kind of decline for energy prices as well, perhaps, as the Canadian and Australian dollars. Normally trends tend to run through the end of the quarter but… on occasion… those looking to make portfolio changes in early April are sent scrambling by sudden price weakness in the final days of March.
Equity/Bond Markets
In yesterday’s issue we compared crude oil futures from March of 2003 with the present situation while noting that a few of the pre-decline 2003 conditions seem to be in place today.
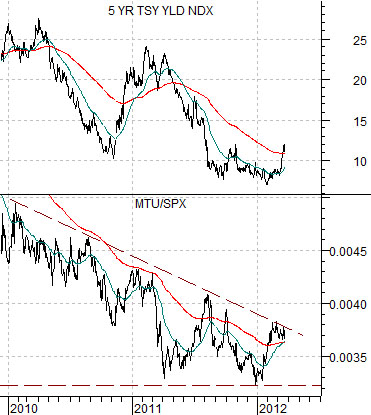
We are going to expand on this example somewhat today. Strangely enough we start out at right with a chart of 5-year Treasury yields and the ratio between Japanese bank Mitsubishi UFJ (MTU) and the S&P 500 Index (SPX).
The point? A significant bottom for long-term yields should go with or, more likely, be preceded by an upturn in the MTU/SPX ratio. The ratio did swing higher around the start of this year but… it has recently stalled at what appears to be resistance. If it continues to rise then yields look higher. If it slumps back to the lows then the entire process will have to start again.
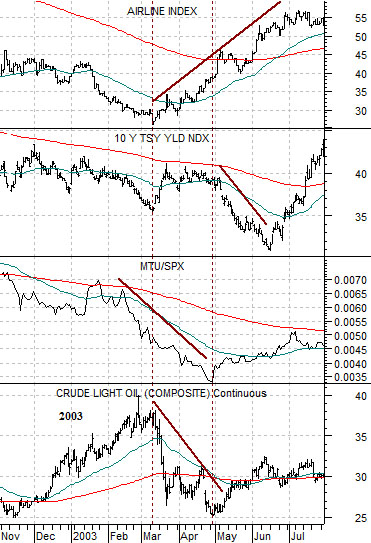
Below is a comparison from 2003 between crude oil futures, the MTU/SPX ratio, 10-year Treasury yields, and the Airline Index (XAL).
When crude oil prices peaked in March of 2003 the Airline Index was at a bottom. The airlines responded positively to the decline in oil prices.
When crude oil prices started to decline the initial reaction by the bond market was to push yields higher as 10-year Treasury yields moved up from around 3.5% to 4%.
Through the decline in oil prices the MTU/SPX ratio was trending lower.
At the bottom for oil prices around the end of April the airline stocks were still on the rise.
At the bottom for oil prices the MTU/SPX ratio made its cycle bottom. Over the next three years MTU rose about four times more than the broad market.
At the bottom for oil prices long-term interest rates began to decline. The six week-long oil price decline was followed by a six week move lower for yields.
While we haven’t shown the comparison the S&P 500 Index responded positively to falling energy prices in 2003. A much different outcome took place in 2008 as commodity and equity prices collapsed in tandem.
If there is, in fact, a point to all of this it might well be that nothing is a given. On energy price weakness we would expect to see concurrent weakness in the commodity currencies and there is a reasonable chance that yields will remain under some kind of pressure.
On the other hand of greater importance (to us) is the position of the MTU/SPX ratio. Was the recent rally just another upward spike in a long-standing bearish trend or, perhaps, was it the cycle bottom that foretells the start of an uptrend for long-term yields?
Will the equity markets collapse with energy prices or hold flat or even rise? The answer to that question has yet to be determined since downward pressure from the energy stocks has to be more than offset by sectors such as pharma, biotech, and tech as well as cyclical energy ‘users’ like the autos and airlines.