It seems that every time we turn around the markets are at some kind of major ‘decision point’. One would think that eventually we would get past all of the ‘teetering on the edge of yet another abyss’ moments so that we could kick back and enjoy the ride. Wishful thinking.
While we pay attention to what the Federal Reserve is saying and doing there is a good chance that the markets are reacting to policy changes from the People’s Bank of China. The PBOC moved to ease credit in late November of last year by reducing the bank reserve requirement ratio. A second reduction was implemented last month. To a certain extent the current bullish asset price trend may simply be an extension of a more stimulative monetary policy from China.
In any event… is the third time the charm?
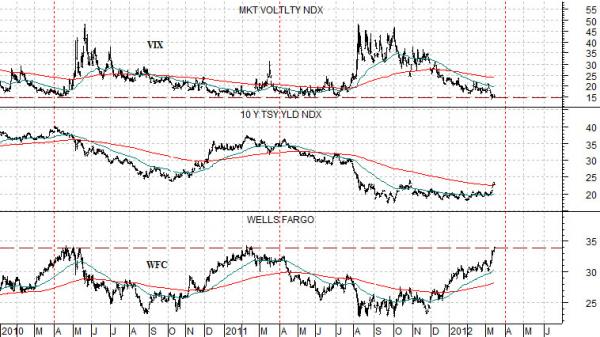
Below is a chart comparison between Wells Fargo (WFC), 10-year Treasury yields, and the Volatility Index (VIX).
On two prior occasions the share price of WFC rallied up to the 34 level. This happened in or around the end of the first quarters of 2010 and 2011.
As WFC rose to 34 the VIX declined to roughly 15. The peak for WFC also went with the basic high for 10-year yields.
For the third time in as many years we find Wells Fargo’s share price pushing up to 34 close to the end of the first quarter. The VIX ended yesterday within spittin’ distance of 15.
The bullish argument would be that 10-year yields have only just begun to rise so this is unlikely to be a ‘top’ suggesting that the rally has much further to go. The bearish counter would be that rising prices into March are consistent with recent years, the VIX has declined to back to but not below support, and if the Bank of China decides to stop easing bank liquidity the market we could see long-term yields tumble even from current levels.
Equity/Bond Markets
IF the rally were to stall we can think of two possible reasons. First, weakness in China. Second, a significant decline for oil prices.
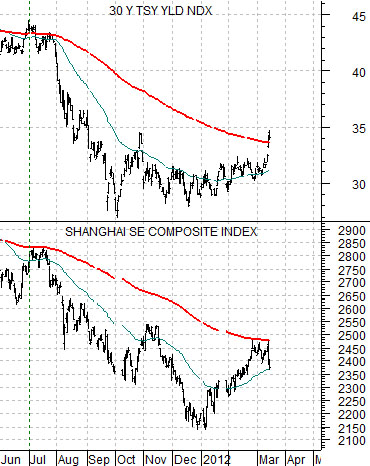
Below is a comparison between China’s Shanghai Composite Index and 30-year U.S. Treasury yields. The Shanghai Comp. has stalled- so far- at the 200-day exponential moving average line. The last time this happened was back in July of 2011. Notice that 30-year Treasury yields were struggling at the 200-day e.m.a. line at that point in time as well.
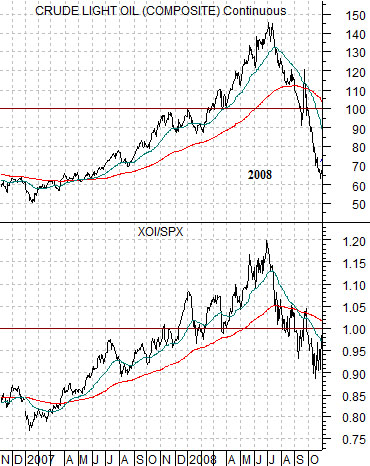
At top right is a comparison between crude oil futures and the ratio between the Amex Oil Index (XOI) and the S&P 500 Index (SPX) from late 2006 into the autumn of 2008.
We have argued that when the XOI/SPX ratio rises above 1:1 (i.e. the XOI moves above the SPX) the price of crude oil is ‘fair’ in triple digits. The ratio rose with oil prices during 2007, moved above 1:1 in advance of crude oil pushing through 100, and then peaked and turned lower a few weeks before crude oil prices collapsed.
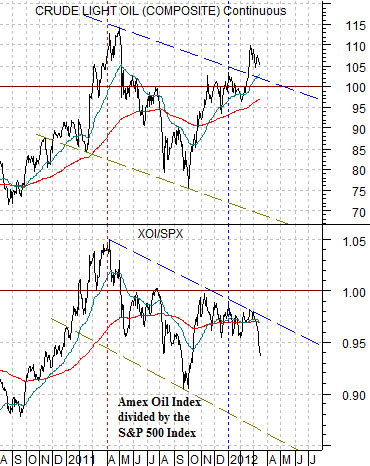
Now consider the same comparison for the current time frame shown below right. The chart argues that the basic trend for energy prices is still ‘down’ and that crude oil futures prices really shouldn’t be north of 100 given the weakness in the XOI/SPX ratio.
The point? There is probably 10 to 20 worth of ‘air’ under oil prices at present based on concerns with respect to Iran. Whether the markets would react in a bullish or bearish manner to lower oil prices is another matter entirely however. All of which rather simply suggests that once again the markets are teetering on the edge of some kind of important ‘decision point’.