We have- surprisingly enough- a bit of an odd view with regard to the trend for energy prices. However we won’t get into an explanation until today’s second page. For now let’s set the stage somewhat.
The reality is that crude oil prices are still very strong. Oil prices rise on positive U.S. economic data, on the prospect for positive data, on the hint of better growth from China, on even the faintest glimmer of optimism from the Eurozone, on dollar weakness, on Middle Eastern concerns, every time supply is reduced or there is hope for an improvement in demand, when commodity prices in general move upwards, when the weather turns colder, when the weather gets warmer, on a boat, with a goat, etc.
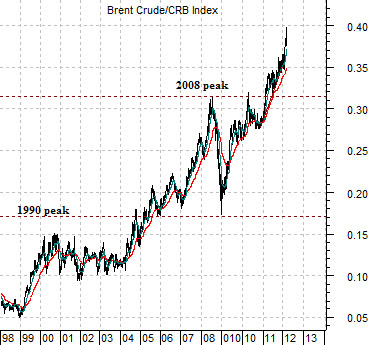
First is a chart of the ratio between Brent crude futures and the CRB Index.
At the end of 1998 the price of Brent was around 5% of the value of the CRB Index. At the Nasdaq’s peak in 2000 the ratio had tripled to 15%. In 2004 the ratio moved to new highs which initiated the upward trend for U.S. short-term interest rates and Fed credit tightening that ultimately helped to collapse home prices and much of the U.S. banking system.
By 2004- 05 the Brent/CRB Index ratio had moved above 1990’s Gulf War peak. It continued to move upwards into 2008 when it touched above 31%. The equity and commodity markets collapse that year hammered it back down to the 1990 peak around 17% but now… it is stressing 40%. From 1998 into 2012 the price of Brent crude relative to general commodity prices has increased by a factor of 8 from 5% to 40%.
The point? First, the energy price trend has, by and large, been driven by Brent crude futures. Second, there is a link within the markets between North Sea oil (Brent) and the U.S. gasoline price ‘at the pump’.
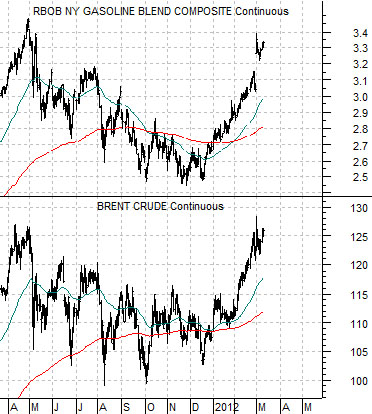
Next is a comparison between Brent and gasoline futures. The argument is that the trends are virtually identical. Whether this does or should make sense is somewhat moot but the reality is that as long as Brent crude oil futures keep rising there will be upward pressure on U.S. refined products prices which, in turn, shows up as an increase in the share of income spent by U.S. motorists on fuel and a reduction in the amount of income available for consumption or savings.
Equity/Bond Markets
The entire section above could be summarized as follows: Crude oil and gasoline prices keep rising. Relentlessly.
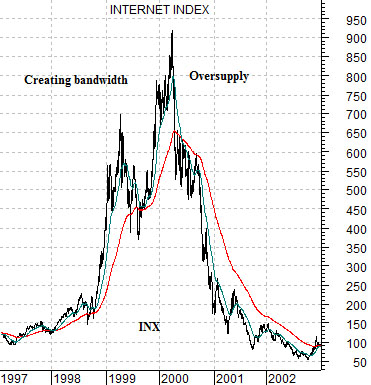
Below is a chart of the Internet Index (INX). We could have used the Nasdaq or, perhaps, the charts of Microsoft, Intel, Nortel, or Cisco but this should suffice.
Money is constantly moving in search of the highest returns. When demand exceeds supply prices tend to rise until conditions come back into balance. Our argument is that the ‘bubble’ in the tech and telecom sectors through the end of the 1990’s reflected the ‘demand’ by the markets for internet ‘infrastructure’.
In any event… the Internet Index moved upwards into 2000 as the markets poured money into the companies that were, in a sense, working to increase the supply of bandwidth. Eventually bandwidth supply expanded to the point where it exceeded anticipated supply and prices collapsed. Fair enough.
When demand is larger than supply then the markets will work to increase supply. What happens when supply exceeds demand? The opportunity for higher returns shifts from the builders of infrastructure over to the ‘users’.
In a sense many of the biggest winners over the past decade have been associated with the usage of bandwidth. Apple would be an obvious example along with Facebook, Google, Skype, and Netflix. Companies producing products or services that use the foundation of infrastructure and the supply of bandwidth put largely in place through the previous cycle.
So… what does this have to do with energy prices? Nothing and everything. Perhaps.
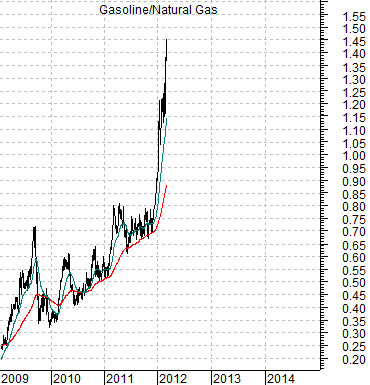
At bottom is a chart of the ratio between gasoline futures and natural gas futures.
The major difference between 2008 and 2012 is that in 2008 crude oil and natural gas prices were rising in tandem while in the current situation gasoline prices are rising while gas prices are in decline.
Our sense is that this is in some respects similar to the Internet story pre and post 2000. Pre-2000 was all about creating supply while post-2000 had more to do with finding ways to use the supply.
In the last number of years vast quantities of natural gas have been discovered. The markets pushed money towards those companies involved in the exploration and production of natural gas. The increase in supply has created a price divergence between crude oil, heating oil, and gasoline in comparison to natural gas which has driven the ratio between gasoline and natural gas up from around .25 at the start of 2009 to move than 1.45 today.
The point? The years following the Nasdaq’s price peak brought us growth stories like Apple and Netflix. The next investment cycle might well be focused on companies that find new and innovative way to replace the use of crude oil and refined products with that of natural gas. We have the supply so the next step is to ramp up demand.