
Reminder: David is available to chat with Members, comments are found below each post.
They say a picture is worth a thousand words, one needs look no further than the chart below for that.
It’s a great example in the event that the market tops out and how to protect oneself and more importantly how to profit from that should it occur.
We’ve been highlighting a lot of patterns that are of the “Change In Trend “ variety (in this case up to down) and of the “Short Sell Set Up Variety. Overall we call them the “What to Watch For” when looking to short sell and the “What to Watch Out For” if one is long or looking to go long.
The other day we showed you an example of what a Head And Shoulders Top looks like and what a First Thrust Down Short Sell Set Up Pattern looks like in the chart of SLW.
Today we are going to show you one chart that has everything one could ever look for in a chart. There are so many patterns embedded in it that we focus on at All About Trends on a daily basis its not funny. To say the least this chart needs to be (and will be) included in our hall of fame for educational purposes to refer back to time to time. One would do themselves well to print it off for you’re own hall of fame.
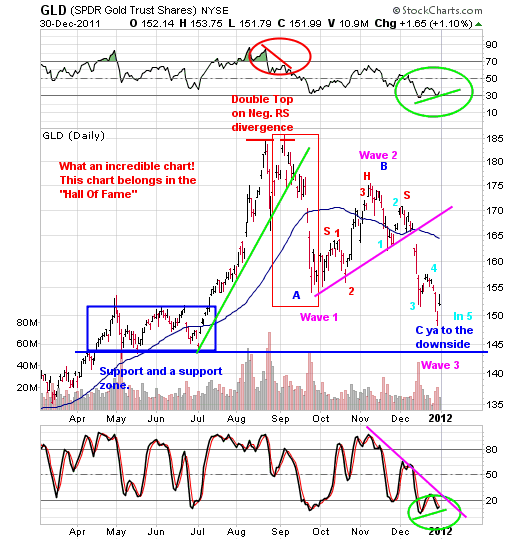
Double Top
There are a lot of patterns in this chart so let’s first off take it from the top as in Double Top with Negative RS divergence (green circle). From the July lows (everything above the green line) this issue took off like a rocket! Hot highly emotional on a red bull sugar high money loves this type of stuff. They love chasing buses which when all said and done as you can see is hazardous to ones financial health. There came a time when the issue was putting in what we call an early warning alert change in trend pattern that you all call a double top. Our mantra at All About Trends with these is:
“Nice uptrend, above the 50 day, puts in a double top and breaks to the downside.”
Notice that once it broke to the downside it stopped back
…

