Our intermarket arguments are going to get a good test in the days to come. We have suggested that crude oil prices are headed lower in response to a stronger dollar and slower Asian growth. On the other hand crude oil futures prices were higher yesterday in response to stronger U.S. economic growth, pressure on Iran to curtail its nuclear program, and the largest weekly inventory declines in a decade. On the one side… intermarkets. On the other… rational fundamentals. We will watch with interest.
We dove back to the 2-year lag argument yesterday so we thought that we should at least show an example from a prior time period to help explain the idea.
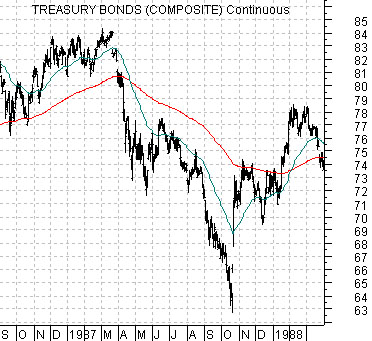
First is a chart of the U.S. 30-year T-Bond futures from September 1986 through March of 1988. In essence we are looking at the bond market in front of, through, and after the October 1987 stock market ‘crash’.
We have argued that the stock market’s collapse was more of an adjustment in relative prices than a pre-depression indicator. The problem was that stocks and bonds were trending in the same direction but once bond prices began to drive lower in the spring of 1987 economic or cyclical momentum continued to push stock prices higher. In other words… bond prices began to fall, stock prices continued to rise, and then in October the stock market collapsed as bond prices pushed higher.
We often comment that there was a race by economists in the autumn of 1987 to state that the ‘depression starts now’. Similar to bloggers and tweeters today the idea was to be first out of the gate with this dire view. The reality, however, was that economic growth continued to expand until the 1991 recession.
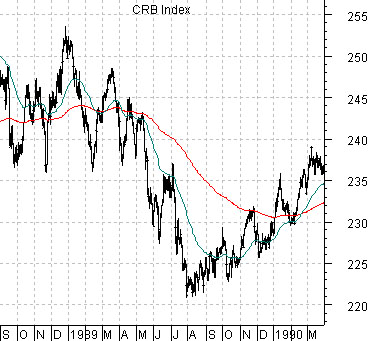
The 2-year lag argument suggests that bond price weakness in 1987 should show up in cyclical price weakness two years later. Below is a chart of the CRB Index from 1988 into 1990 (i.e. lagged 2 years behind the TBond futures). The decline in bond prices in 1987 preceded the peak and decline in commodity prices by 2 years. Hence… the 2-year lag.
Equities/Bond Markets
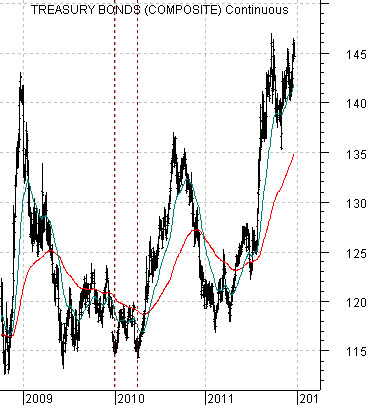
Below is a chart of the U.S. 30-year T-Bond futures from late 2008 to the present time period.
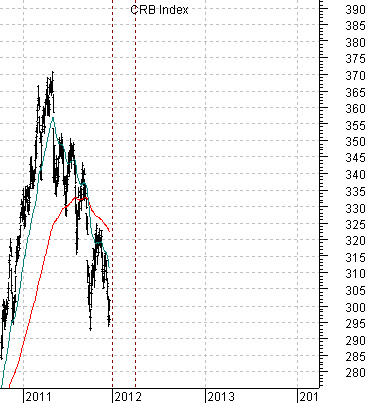
Next is a chart of the CRB Index from late 2010 forward.
Similar to the first page we are comparing the trend of the bond market with that of the commodity market based on a two year lag.
The idea is that the decline in cyclical asset prices (commodities) through 2011 lines up with the fall in long-term bond prices during 2009. Fair enough.
The trend for bonds turned positive around the first quarter of 2010. By ‘around the first quarter’ we mean that the trend began to improve at the start of the year only to sag lower into the end of the March. This creates a window of time through the first few months of next year when commodity prices could remain under pressure… likely as a result of further gains in the U.S. dollar.
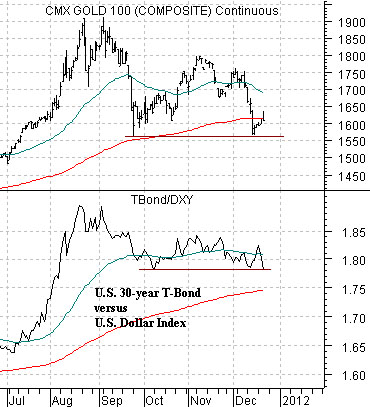
Below is our comparison between gold futures and the ratio between the price of the U.S. 30-year T-Bond futures and the U.S. Dollar Index (DXY) futures.
We are moving this up to the second page because the TBond/DXY ratio retraced the recent gains to close on support yesterday. The argument is that if this ratio continues to decline either through dollar strength or bond price weakness then gold prices could ‘give’ the recent lows and move down into a new trading range.
Technically the next rally point for gold would likely occur just after the 50-day e.m.a. crosses down through the 200-day which means that if gold takes out the lows it will be a few weeks- at least- before it would make sense to look at gold from the long side. We will leave it at that.