The news remains… dire. Report after report focuses on a sovereign debt crisis shifting into a full-blown banking system crisis. The good news, we suppose, is that the markets have been fixating on this issue for much of the year.
As we mentioned last week we try to focus less on the news and more on the markets. Tops are made when economic growth is the strongest and bottoms are set when sentiment is at its worst. Is this the bottom? We have no idea but our sense is that the markets are certainly making an effort to carve out a low.
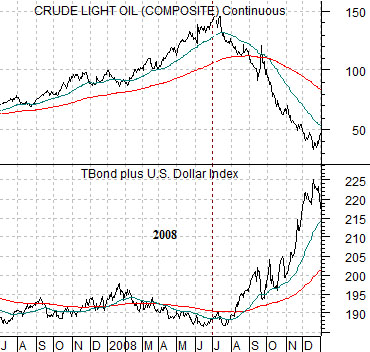
First up is a chart from 2007- 08. It compares crude oil futures with the sum of the U.S. 30-year T-Bond futures plus the U.S. Dollar Index (DXY) futures.
The argument is that the trend for oil prices is the inverse of the trends for the dollar and bond market. A weak dollar supports stronger commodity prices while a weak bond market reflects the kind of economic strength that leads to rising energy prices. When the dollar and the bond market are both trending lower we tend to see strength in energy and base metals prices.
Crude oil futures prices continued to rise into the middle of 2008. The trend only turned bearish once the dollar and bond market began to lift. Fair enough.
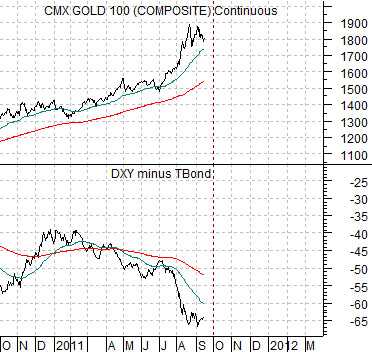
Next we show gold futures and the spread or difference between the U.S. Dollar Index and U.S. 30-year T-Bond futures.
Crude oil trends off of the dollar and bond market. Gold, on the other hand, trends off of the spread between the two. The best combination for energy prices is a weak dollar and bond market while the optimal intermarket backdrop for gold comes from a weak dollar and strong bond market.
The point, by the way, is that we have recently seen just enough dollar strength and weakness in long-term bond prices to suggest that gold prices may have reached a top around the end of August. If gold prices actually have made a peak then the argument would be that we are already somewhat past the worst point in time with regard to the recent spate of crises.
Equity/Bond Markets
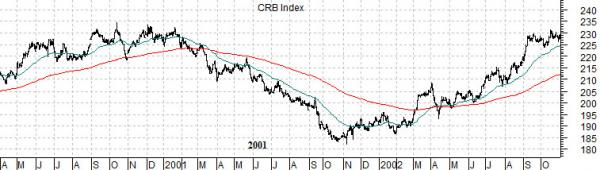
From time to time we show charts of the CRB Index into 2001 and Japan’s Nikkei 225 Index into 2011. The argument is that the cyclical trend is set to turn positive around the end of this year with Japanese asset prices serving (perhaps) as the dominant theme over the balance of the current decade.
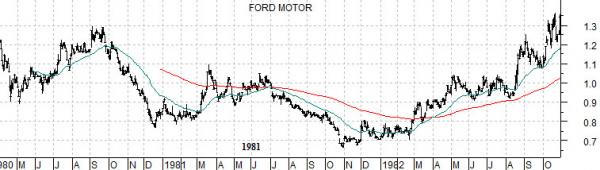
We thought that we would put another spin on this argument by showing a chart of Ford (F) from 1980- 82 and the CRB Index from 2000- 2002.
The premise of the Decade Theme is that the markets follow a similar path from decade to decade with different sectors showing strength and weakness.
The charts below make an interesting case. The share price of Ford bottomed in the final quarter of 1981 in a manner similar to commodity prices in 2001.
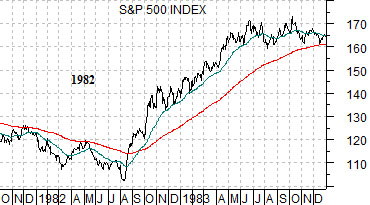
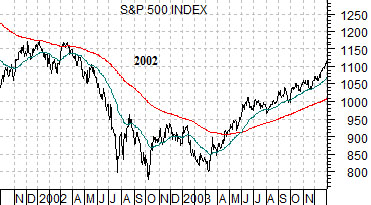
Yet… that really isn’t our point today. At top right we have added charts of the S&P 500 Index through 1982 and 2002.
The SPX bottomed in August of 1982 and October of 2002. In terms of the broad market the lows were set some time during the second half of the ‘2’ year.
If the consumer cyclical (i.e. autos) sector dominated the 1980’s while commodity-oriented themes dominated the 2000’s the argument is that both themes turned higher well ahead of the broad market. If history were to repeat we could see relative strength starting to emerge from the sectors that will lead the charge and define the trend over the final few months of this year.