
Reminder: David is available to chat with Members, comments are found below each post.
|
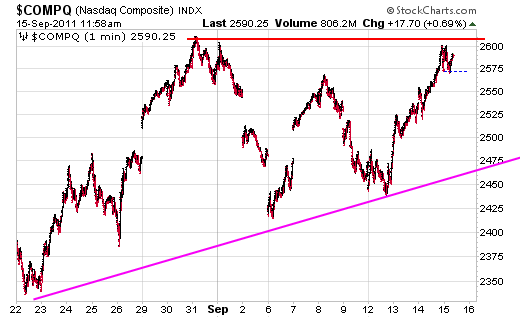
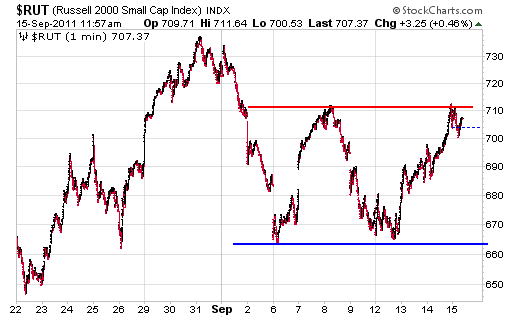
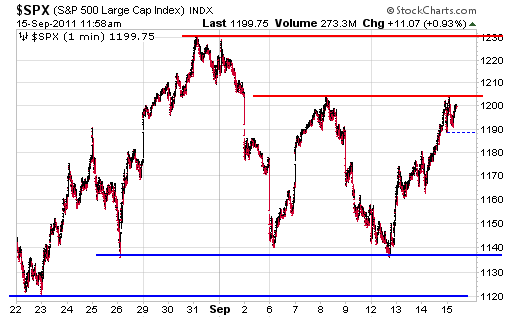
If you are wondering why we stopped where we did look no further than the short term one minute charts below.
   Yesterday we said:
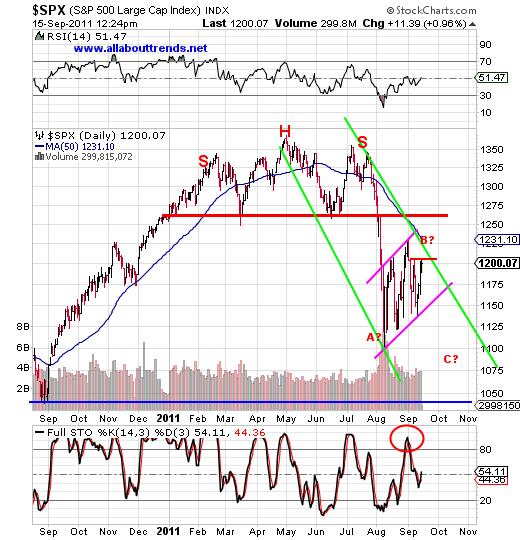
We’re still in the channel so anything goes till we get a decisive break. Even if that break is higher we’ll still stay in the channel BUT we’ve got massive resistance above on multiple fronts.
9-15 And this is where we find ourselves today.
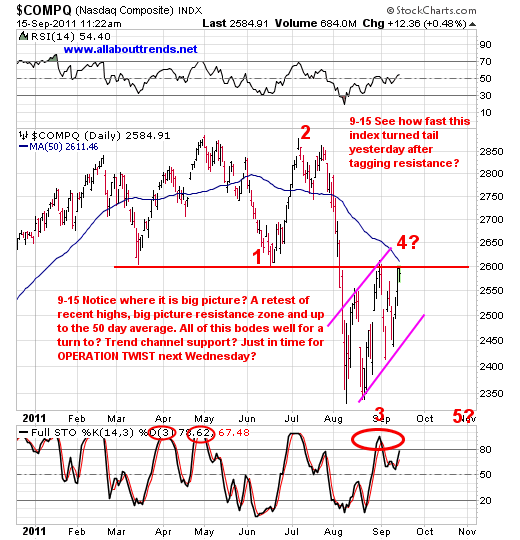  That all said, if it wasn’t for next week being the Fed’s operation twist meeting we’d be extremely bearish. Remember this whole climate is dominated by news driven events, they work for you and against you. Now keep in mind we have no clue how the market is going to react to the fed next week. The trend has been any sort of QE has been cheered. Should that be the case they could run us higher (All within the channel mind you) on that.
HOWEVER short term here (remember the short term trend has been 2-3 days up, 2-3 days down, wash rinse repeat. Great for a scalper very difficult for an investor long or short) we are extremely overbought in the 60 minute time frequency charts and have tagged a resistance level as shown in the daily and one minute charts.
That all said we could easily sell off here. But to where? Ahhhh baring a news driven event? How about trend channel support right into the fed. In so doing over the next few days it would allow the Full Stohcastics in the 60 minute time frequency charts to reset themselves to oversold just in time for the magic pump up the volume.
Keep in mind this is a forward thinking assumption based upon the current chart action and future news driven events we know that are coming our way. Whether it comes to fruition is another story as nobody really knows. Call it a potentiality, one that should it occur we would be prepared in advance for.
So assuming something like that transpires ? We’ll use market
|
…

