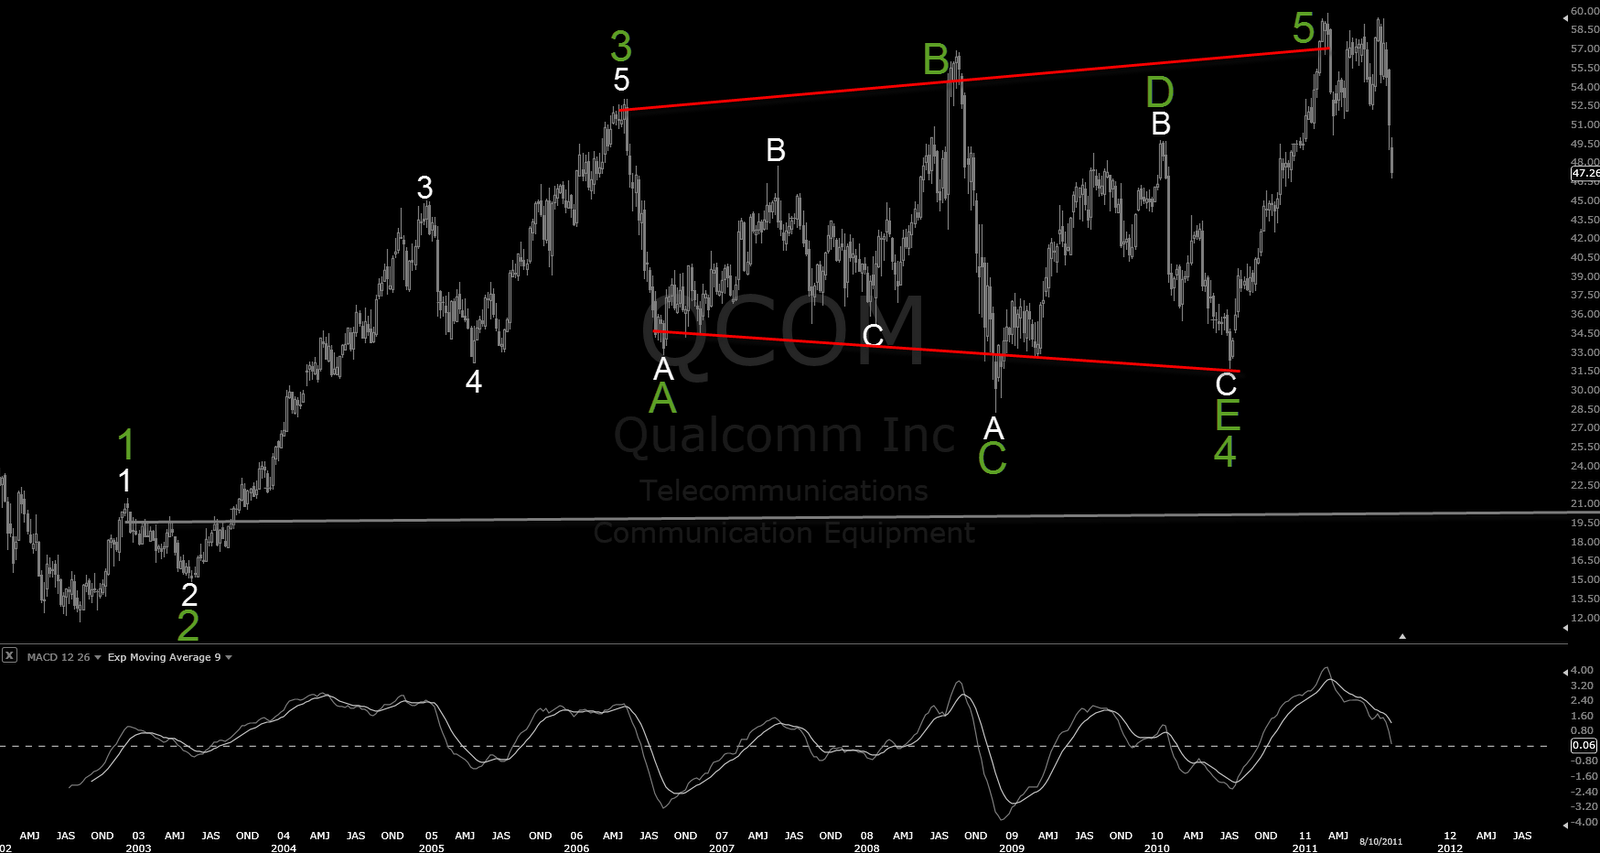
There is very attractive setups out there when one changes for weekly charts, with equities of cource, here´s for instance Qualcom which I re-post. It endeed started to correct also.
While with impulse waves this world is reasonable simple if divergences are there also with W3 and W5, I do afraid that guy everyone hates, Mr. Prechter was correct what is going to happen.
This market has came down now incredible quickly and fast with-in just a few weeks time. To think it as simple correction with this volalitet it could easily reach SPX860 with-in just a few weeks which would be W2 retracement for this impulse wave we came up during the passed years.
Now, corrections cannot run this quickly really, it would mean we practically are there allready with very little selling anymore during this autumn. I personally don´t believe this market will get there just like that without giving very large rally between. At some stage bulls are starting to fight back and some newsflow will pump up this market significantly.
When that happens, market starts to play time and we are correcting W2 for upside.
If we do consider this correction would take for instance 1 year before finished it also means we haven´t even see yet W3 plunge which would be C wave and more than likely way much bigger that first A wave which we still haven´t finished.
Based for this, my target for this correction is SPX 400-500 points which I don´t believe this market will reach during this year yet but I assume anything is possible.
Some very large B wave in the middle will occure where bulls fights back also.
In shorter term still tracing if any new lower lows would start building something for hourly Macd, so far there is nothing as divergences.
Attatched also weekly chart SPX topping fractals where divergences are.
The alternate however where market will fight back very significantly I assume if and once reached would be 862 because that´s where potential W2 for comes possible for bullish count.
It sounds allmost gracy to mention these numbers but in this volalitet actually not even 860 does not sound much anymore.
What I think is going to happen is that somewhere above of 1000 points hourly chart EW reversal will be build where this market rockets up very large correction. Once and if that happens, it is actually increasing the odds for me we go all the way down once that correction for upside is done and I do afraid it won´t happen quickly by time and potentially not even during this year.
Btw. both of those SPX charts are 1 day old one´s but one day is noise for them anyway.