I´ll post this one chart as weekly & daily.
But it explains what we have in here a lot since it is not unique case at all, there is lot of them as fully equal.
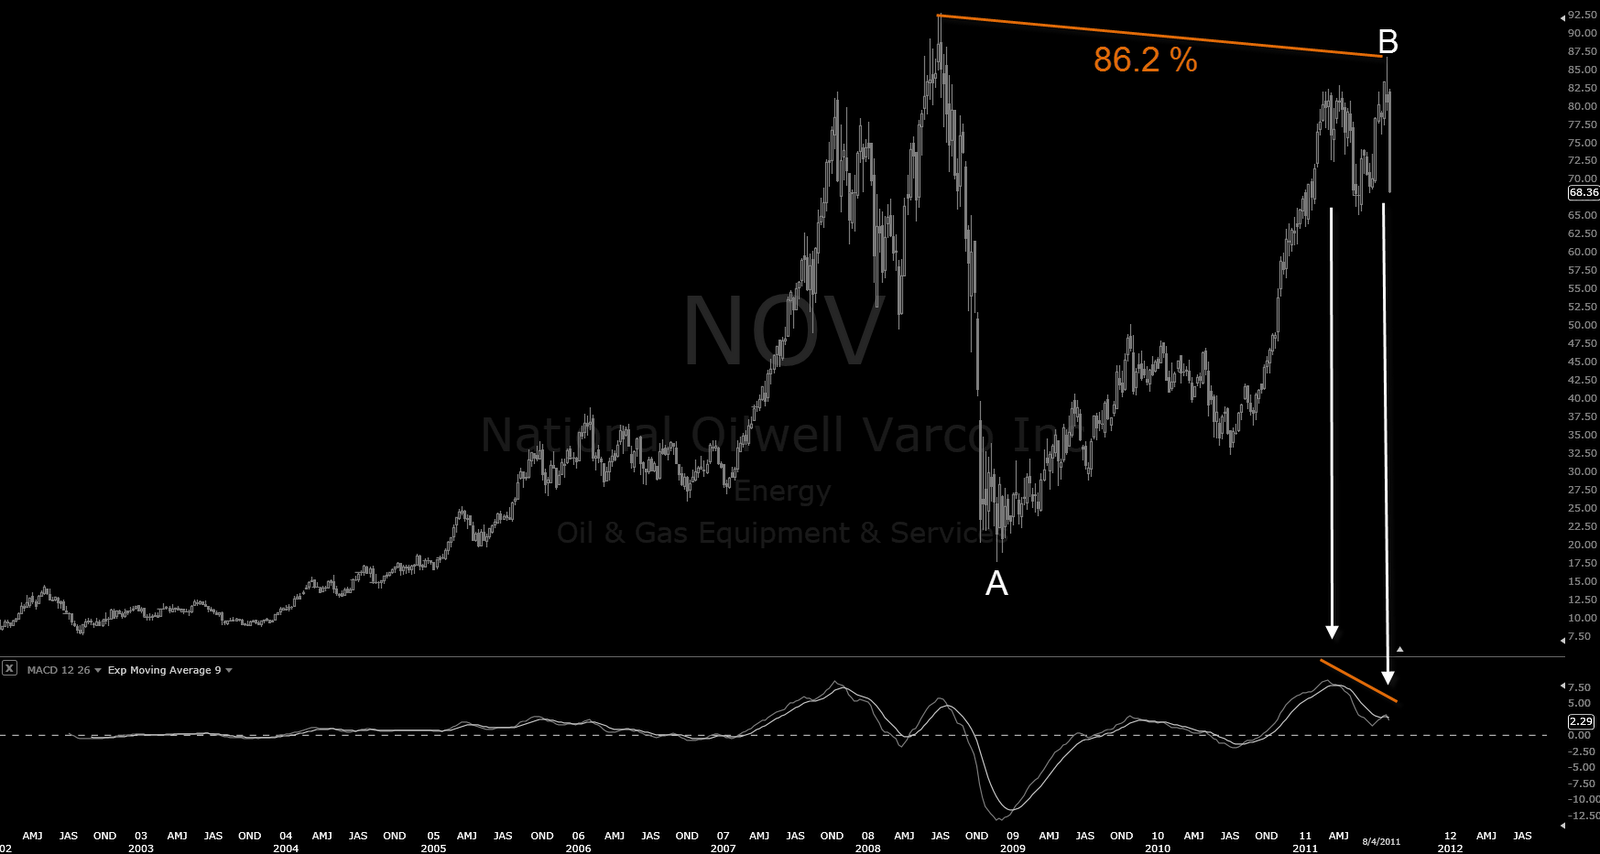
Many equities has reached 86.2% retracement for weekly charts which is top of previous high and which is max. most often for any B wave correction.
If we would force it to be bullish we would of cource mark W2 for that financial tsunami bottom but in that case it is still bearish since one impulse is fully done, it would become bullish only with one full ABC sequence to retrace potential another W2 for it ie. 61.8 % & 78.6 %.
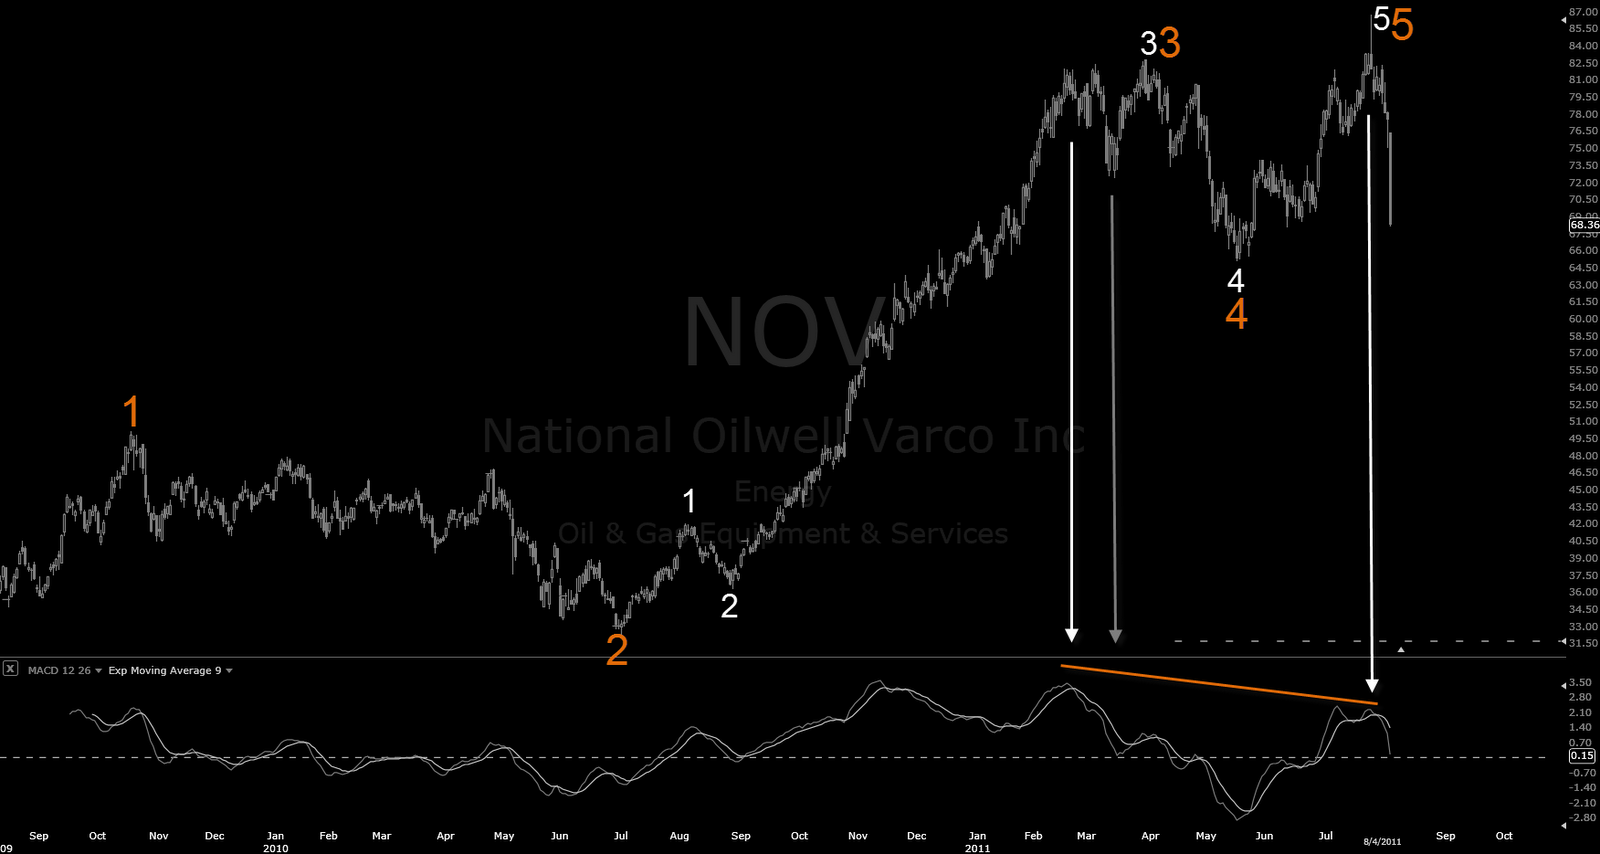
Divergences are clear, even if it would go up it could not breake anymore this daily chart previous high because market would immediately consider it as A wave down….then B up…. and C down again.
These are also the charts I am looking, any B wave up for daily chart where weekly B wave as 86.2% is set allready as higher degree as daily chart.
It´s bearish chart no matter how one look at it, can become bullish some day but that would require a lot more selling to make one ABC for it since now it has nothing, barely first A wave started to land.
Let´s assume third error I could make with those labellings, that would be one additional impulsive degree missing from daily chart – sure, there is more of them.
Drop top of W3 for that daily chart top only but leave one W5 left to be done for actual double top for weekly chart, it would be building at least W4 as minium and that´s not very small either. In that case it would start building cont. triangle at some stage and in that case it would still be bearish chart or sideways charts.
Hard to see it as bullish option, in here, yet.