Even name might not sound familiar but it is SPX500 equity also as it is previou oil chart.
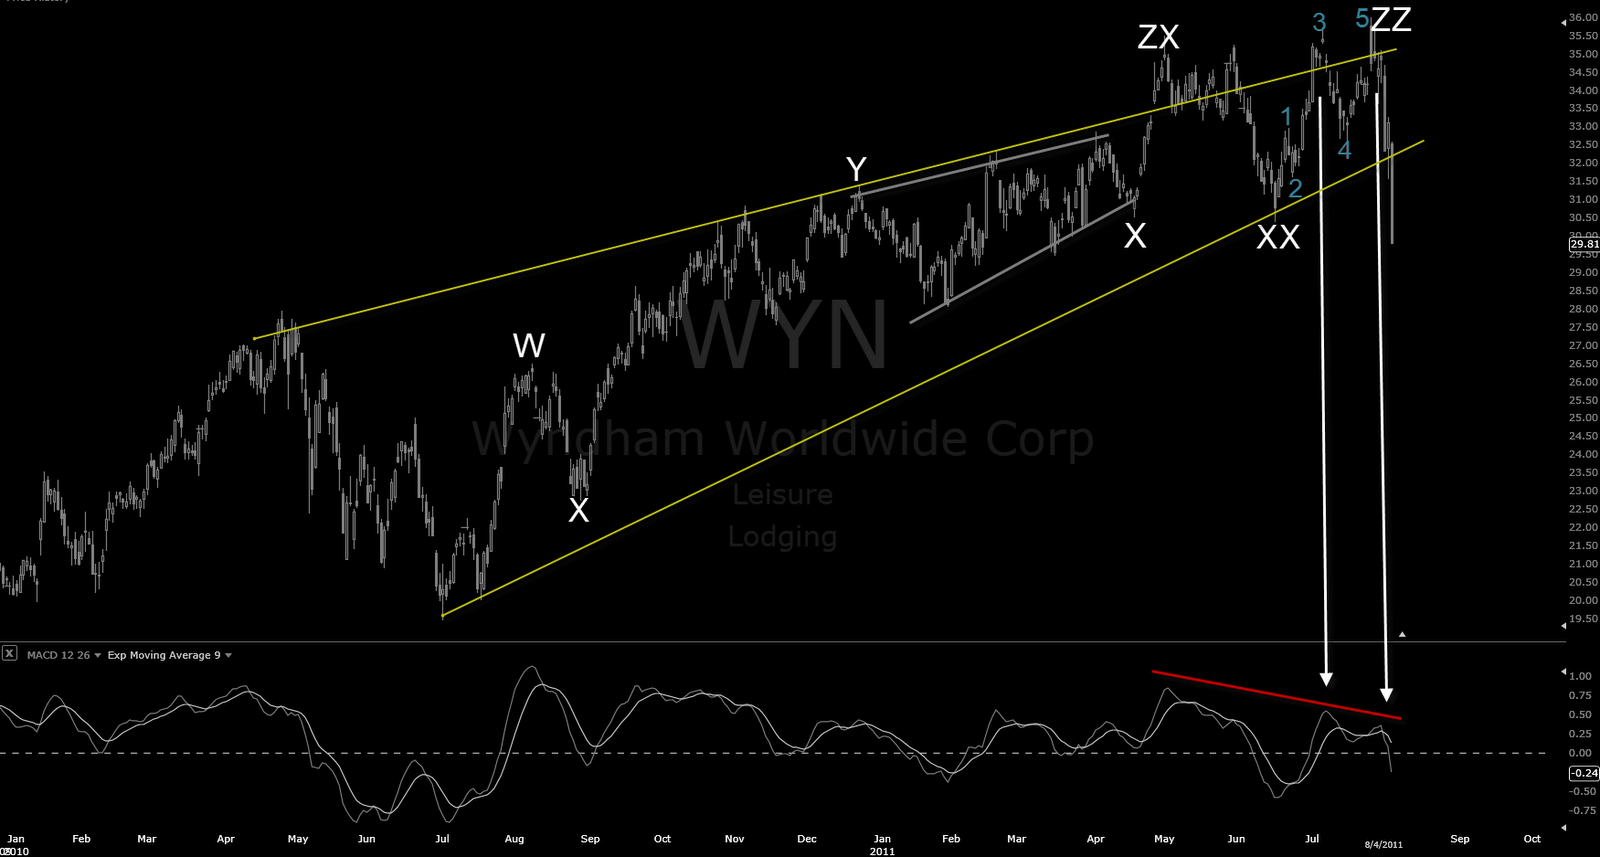
One of them is impulse, either one to the downside or upside but another another one is zigzag based corrective ie. only. Both suggest reversal anyway.
Theory can smash top for this easily, ending diagonals makes it even more easy with those divergences.
Note cont. triangle in X position (or IV position). This had been building this really long with divergences.
Overall, very much same things apply as to the previous one.
Western Refing (WNR), Marathon Oil (MRO)…all same as the one in previous post, well, we had fun with these for long, really long > over the year and half particulary in oil section. One might remember that most of oil chart were also bullish ending diagonals in the bottom in summer 2010……Flotek Industries (FTK) from chemicals as one another case, -17% today after impulse finished as one of them.
My warm recommendation to chart those with daily chart and compare them between each other if looking EW. All same.
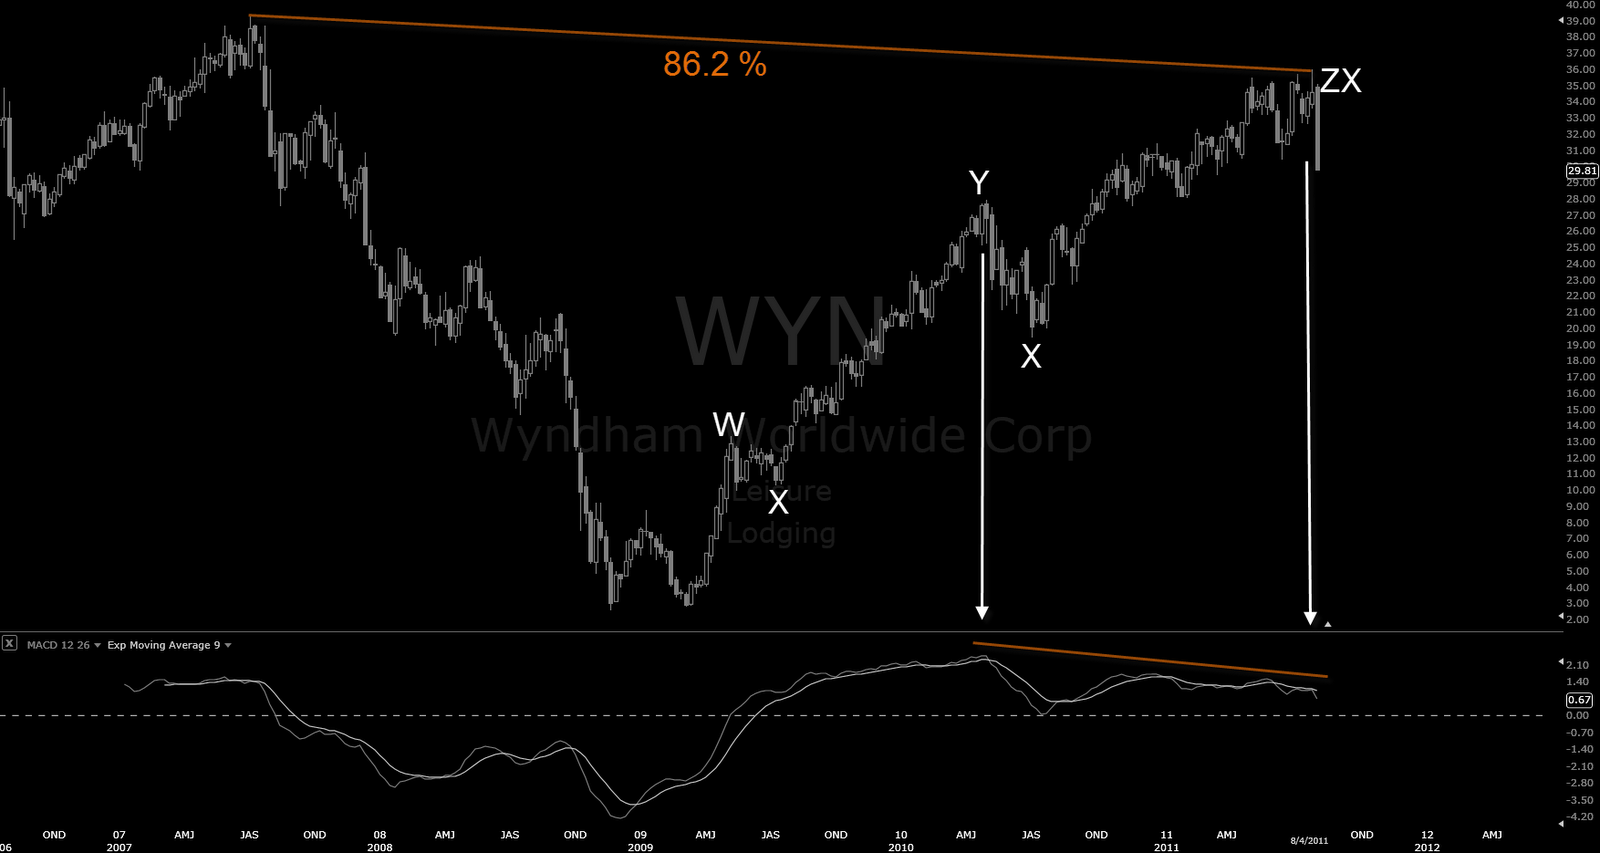
Then look at weekly chart retracement from 2008 high peak. EW is there, all same.