
Train wrecks sell! That is how one reporter put it. The news media has not seen this since 9/11: best of times/worse of times for them, the news media. Today, more than ever, the bearish “doom and gloom” talk is what most, if not all news outlets are propagating, it gets the sale. Every time we turn on the national or international news we hear “Things are really bad out there!”
When you read the real life experiences of investors/speculators like Bernard Baruch several things are prominent. One thing that sticks out is he factored in that everyone’s opinion had a bias. This can mean a number of things as I will point out below regarding the Bearish “point of view. However, when it comes to getting a good read on how to invest the investor needs an objective commentary or advisory only based on a set of objective rules that has gathered in by various means. The methods are of no consequence here, they could be experiential, they could be computer back tested, etc. The important part is they are based on a trained and disciplined analysis of the facts (the facts being price or economic data) and their impact on the market place and its trends. The Thinking Man’s Trader needs to be able to read between the lines.
Last issue of TMT we talked about the media’s bearish tenor and the lack of any confidence regarding the world economy that permeated 99% of all news bytes” But let’s take a step away from the “media band wagon “and look at where Bears come from.
If it is true that the majority of opinions come with a bias, we can make a few logical conclusions. For one it makes sense that a Bear is long on cash and lots of it. They are cash rich ($2.41 trillion) investors or corporations that have missed the most recent buying opportunity and want a new one based on their terms. These terms may or may not have any relevancy in economic theory. The key word here is theory as over the last 100 years economic theory certainly has needed its contents refreshed periodically to say the least.
A Bear can also mean another position, just not cash but they can be short the market to take advantage of the market, if it does decline. One of the more famous traders I have had the pleasure of meeting was Paul Tudor Jones in 1988. He explained a Gann concept, one that I had learned from a mentor Joe Granville. The concept is that a declining market is like watching water going out of a bath tub. At first the level is going down very slowly, however, when the water is reaching the bottom it runs out at a very fast pace. Like a little whirlpool. Point is that a volume and rate of change increases dramatically as the market place copulates, traders are just throwing away the assets as the pain is too much to bear, pun intended. It is in such an environment that shorts can be put on, as the probability of success is high and volume increases to allow you to unwind the shorts in the panic.
Paul also pointed out that there was a big head and should top in the Swiss franc. His forecast was that one of the most reliable patterns to short was the bearish head and shoulders would take out the neck line and prices would decline. Prices did take out the neck line of the top formation, the rate of change increased as prices plummeted and volume spiked and yea you guessed it, but no longer term decline. The market took out the neck line at .64 spiked down to .55 and recovered back through. But from touted Bearish point of view hr touted, he was right twice! We always suspected that Paul had used his reputation to influence in publically stated opinion to get a large pool of traders to go short on the break down so he would have an expansive pool of liquidity you buy back and cover his imagined huge short positions in the Swiss franc. We will never know, but his opinion hit a winner.
Why are bears so negative?
- They find safety in numbers – run with the herd – with the vast majority of pundits and news outlets promoting the next financial crisis, if they are wrong they think so what so was everyone else.
- They have a vested interest in the bearish outlook, either they are rich with cash or they are short the markets or both.
- Bearishness is ingrained in their dogma, it cannot be challenged. The capitalist system itself has to change to one extreme or the other.
- They have an investment position that is bearish.
- It is a Freudian unresolved issue that goes back to faulty potty training? No disrespect intended.
Trading Fact of life #212 (post grad level) If 90% of all traders lose money, they must be following generally accepted trading rules. The 10% who win do not follow conventional wisdom!
The headlines since the last issue remain the same and with the same intent, that is to keep you out of the market. While from a contrary opinion point of view, investors and traders should be accumulating the equity or risk assets.
The price action since February is a high level base for the next up leg of bull market.
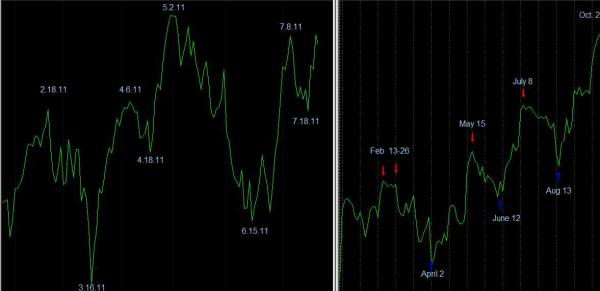
Pictured above is my MarketMap™ for 2011, on the left is the Dow thus far this year and on the right is the Map itself. It has been true to overall trend and fairly true to its high and low pivot points, what I call COT dates or Change of Trend dates. As you can see from our 2011 roadmap prices point higher after a potential sell off near term into mid August. In fact while most analyst are hoping for the Dow Industrials not to confirm the all time new historical highs posted by the Dow Transport just a short 10 days ago, I expect all time new highs. The MarketMap calls for higher prices into late October and late November 2011, a potential double top, we will talk about that as we roll into the autumn of the year
For our Elliott Wave friends, since the peak in February all declines and advances have unfolded in three (3) wave structures, which is a strong indication that the action is counter trend that is correcting the overbought of the previous 12 months of advance. The 200 day moving average, the standard of the industry, is still ascending and prices remain above it plus RSI is finding an trading range between 70 and 40 (not 60 – 30), a bull market pattern. Any weakness into the August 13th time frame into the 1250 – 1285 SP price zone should be viewed as another buying opportunity. New historical highs in the major industrial averages are expected.
For educational online audio/video check out my web site: www.traderassist.com
Interested in IDEAS to take advantage of the market conditions? Check in with my good friends at AGemsCo, Limited and Chris Trading Systems, llc.
Many Thanks,
Jack F. Cahn, CMT

