Updated this same chart again with some things pointed out.
My old triangle D wave upside channel would be reached allready with todays ATH value and it would breake it once proceeding further – so I was forced to expand it just a little, for daily chart change is anyway just cosmetic and same cont. triangle line is there so nothing has actually changed with it.
The most significant change is that most daily stockcharts are also all bullish now with RSI roll-over.
US took this pretty mild way today and it seems 1303.5 was something not well broken today yet but should happen by rest of the week while it was more EU markets driven action.
During the next 3 week I think SPX 1340 will be reached, I don´t even think it is any trouble to get there but what waits on there is better question.
This differs very much from Japan earth-quake drop because at that time we didn´t have W3 / W5 divergence for daily charts placed and that makes this much more corrective as any other correction during this bull-market. For this reason I have my doubts that we would leave this range, it is possible we do and it runs to the 1400 but also far much less likely that earlier during this year because of this divergence.
Daily stockcharts are bullish and longside are favors now, for how long – I think this correction have yet another leg left, time for that just isn´t yet.
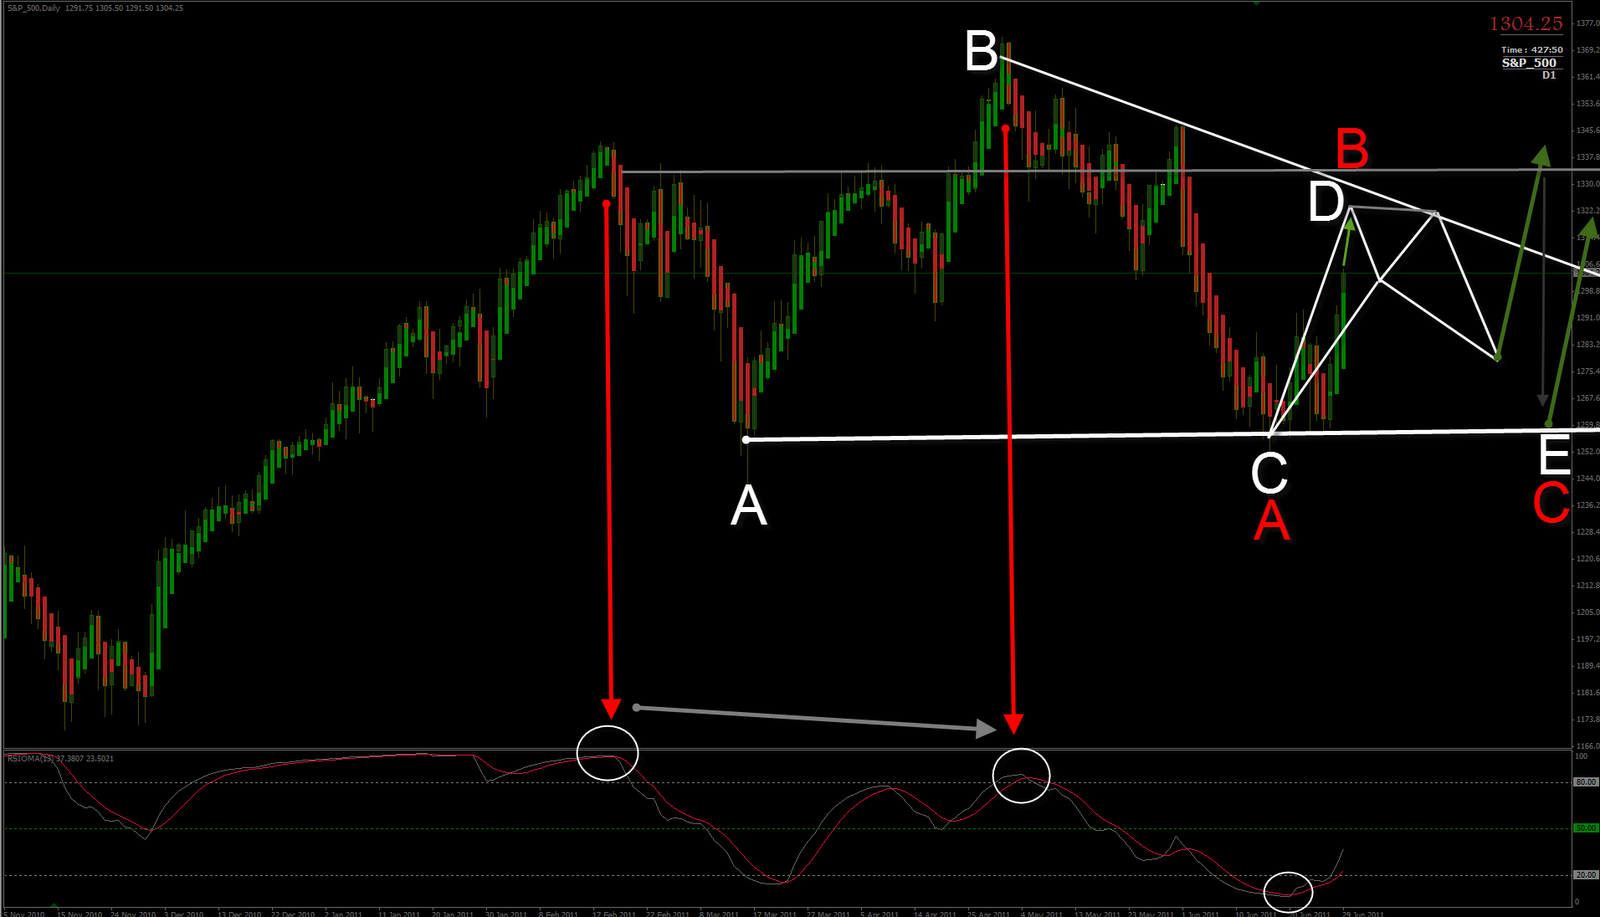
Another one as white lines presents contracting triangle and red labelling marks simple ABC correction.
Bullish gartley in the middle is also possible which would make it as wave 1-2 impulse to open third one which of cource would mean we say good bye for this range (Autumn) while dropping it back all the way down for 1244 would make it bullish contracting triangle.
Target is 1340, below of that smaller timeframes for 1313 and 1320 might breake (plause = pause) this a bit but next higher low might leave this as high as 1284-1290 anymore. We tested 1250 tree times, 1262 twice and 1274 once while oscillators were working with turn. All with their own overlaps.
For this week I think it will reach 1313 reasonable easily since this was global roll-over change in Oil, Aud-Usd, Grains, Stocks, Index etc.
The first internal impulse should be about ready for 1313-1314 from the bottom, any retracement for that can quickly also build smaller timeframe bullish gartley allready in here and be very real also ie. marking W2 bottom. So this all favors longside for next month but to be weeks ahead of the curve is good idea why this train will park again also.
In theory this could also drop 100 points down once B is retraced to build one ABC pattern. C have alternates by size, it is not necessary A=C but multiple scenarios suggest it can in this case because cont. triangle also would end for same area.
It´s bull now, but I don´t think we are leaving this range anywhere near-by time (2 months).All in all, this track has been working well so far. Daily timeframe solves so many troubles for smaller timeframes.
Posted below some currency and oil charts tonight also which should be about “symbiosis” where we are since cont. triangles ends W4, B and X waves.
A lot of Contracting Triangle business in these days 😉