Next week, I think SPX is trying to make tradable bottom in this week – perhaps on mid-week, shall we see 1232-1244 area could be it for corrective B wave, but it can also do lower than that, however I think bounce will be seen and bounce could be seen also before those numbers as zigs and zags.
It can reverse where-ever it wants but I will threat first one as zigzag wave only, daily SPX RSI is still falling and have no signs to offer real roll-over yet and for this reason any rallies are also quickly sold.
Once B upwave starts some day, it can lead this easily back to 1300-1303 area and takes time to build but too early yet to call it to become. However, this B wave once ended also brings us not so beautifull “autumn” or end of summer.
To the question are we still in bullmarket my answer is yes, but we are just in sizable correction.
There is bullish charts also, even stocks making new 52 highs still. Barely any bearish ending diagonals exist.
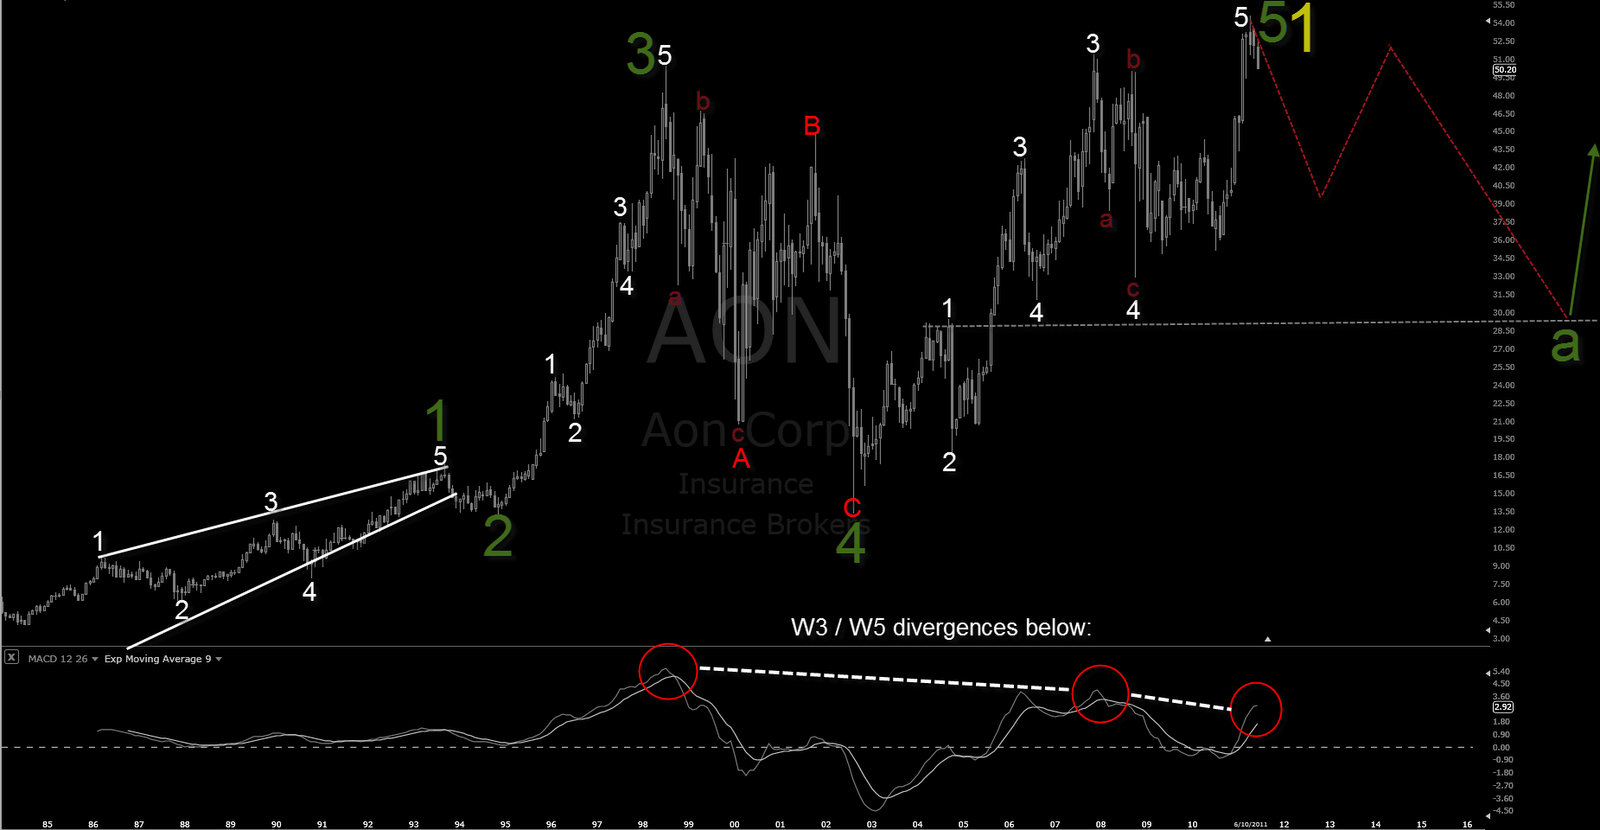
Most of the equity charts are not this bearish but I think this can make pretty decent drop with some time. It´s weekly Macd is not actually suggesting very bearish view with EW divergences, but montly is which is the reason I think it will work also downside. This montly chart could be also one simple ABC alone where each of those 3 waves just breakes for impulses.