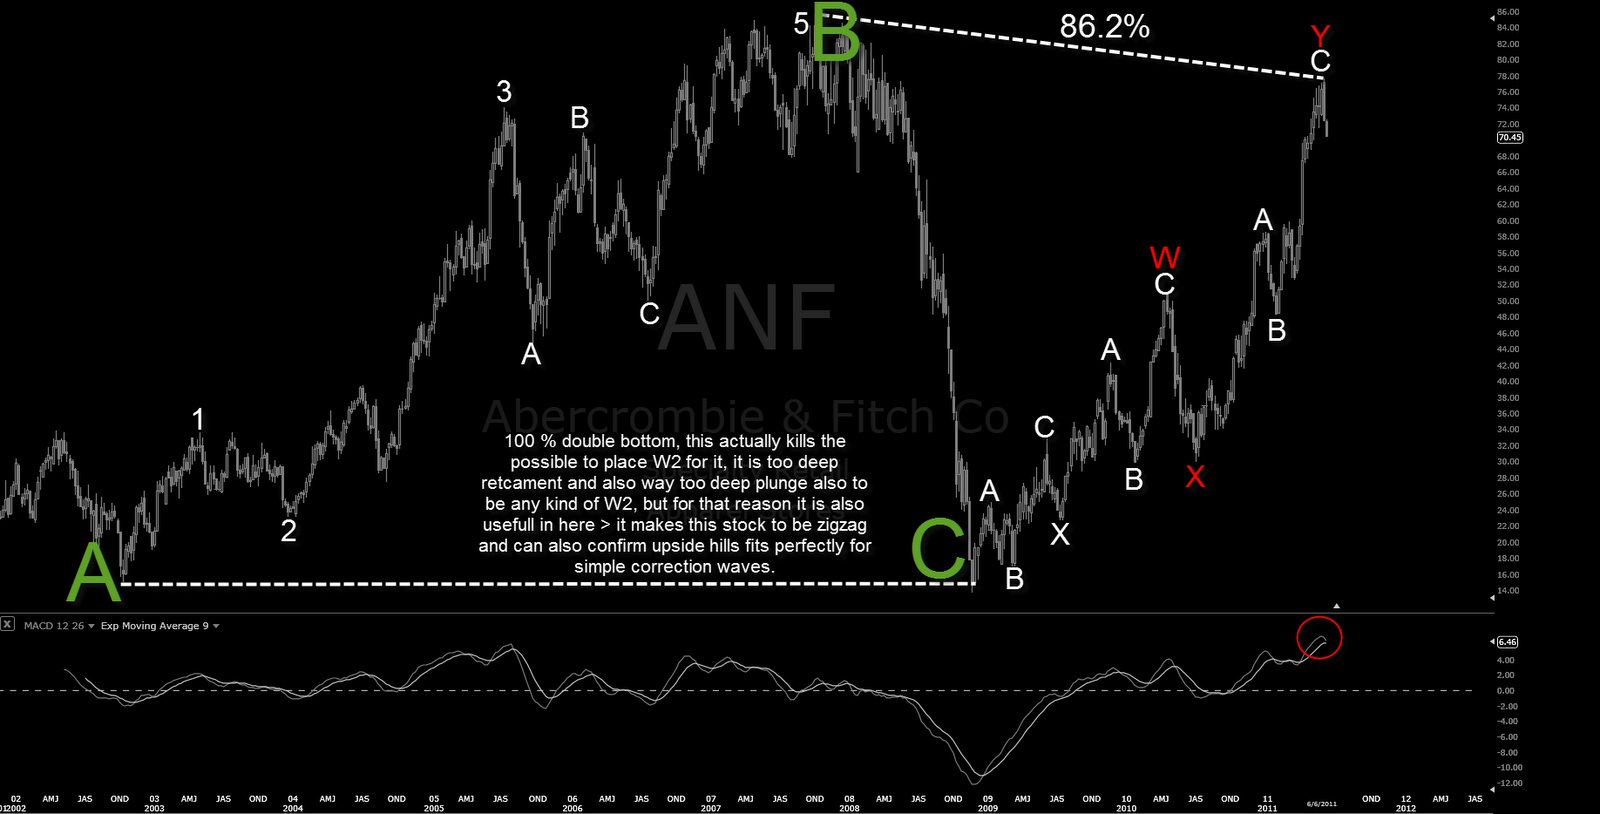
I spot this chart from one non-EW website as bearish case but it got my (EW) attention, particulary this upside road from the bottom. This is weekly chart for it. That last Y wave as second part of zigzag also have daily chart W3 and W5 divergence for which reason I decided to post it also (without it I would not post that at all). I think it is neat, something complex but also top likely placed for that ZigZag wave. 86 $ would also be 100% wave for upside while 86.2% retracement where it stopped was 78 $ for stock itself > Good fibo price relations as secondary. The worse case scenario is possible for that in theory, this green C wave can be W1 and that upside road wave in theory can be end of W2 > opening W3 down. I don´t think it is that dramatic, montly chart would look a bit different with divergence in the case, but we never know for sure…