

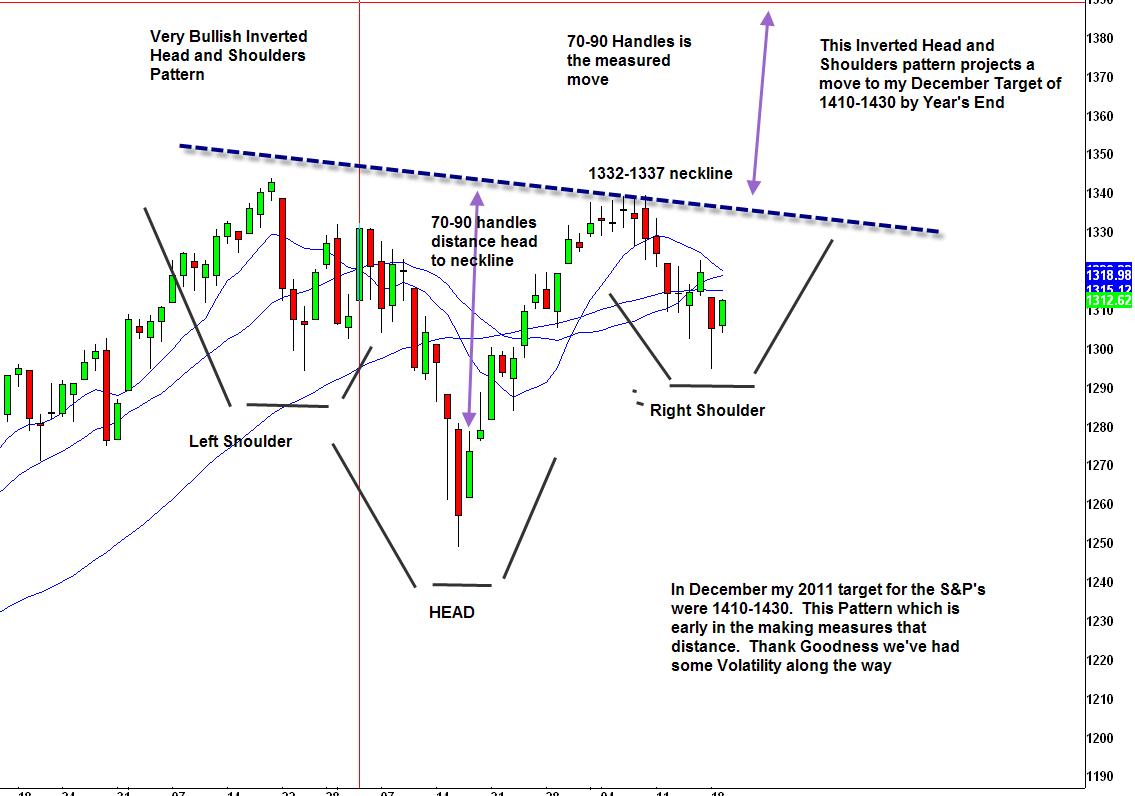
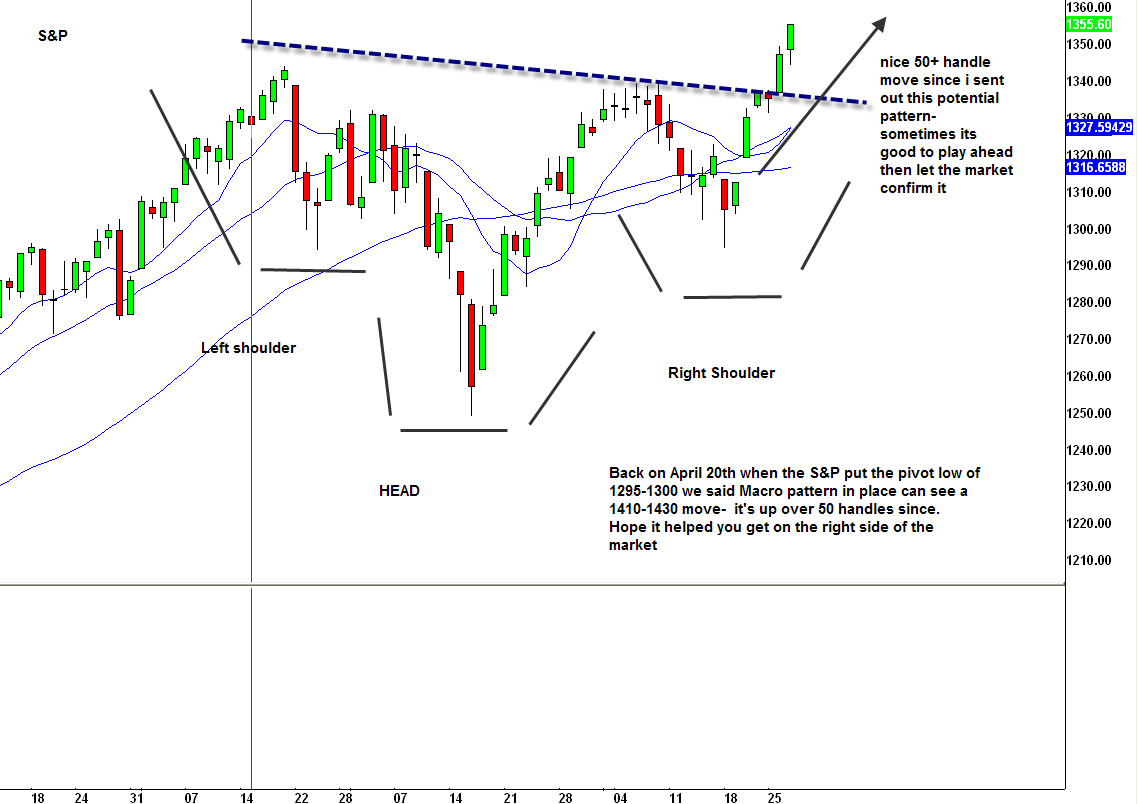
Back on April 20th I sent out these to charts showing a very bullish macro inverted head and shoulders pattern in the S&P. This was when we held 1295-1300, and now we are closing a week or so later about 50 handles higher, well on our way to the 1410-1430 target.
Below are the charts I have sent regarding the S&P pattern. I did sell some of my SPDR S&P 500 ETF (SPY) shares today as we are a little bit extended.
*DISCLOSURE: Long SPY
This material is being provided to you for educational purposes only. No information presented constitutes a recommendation by T3 LIVE or its affiliates to buy, sell or hold any security, financial product or instrument discussed therein or to engage in any specific investment strategy. The content neither is, nor should be construed as, an offer, or a solicitation of an offer, to buy, sell, or hold any securities. You are fully responsible for any investment decisions you make. Such decisions should be based solely on your evaluation of your financial circumstances, investment objectives, risk tolerance and liquidity needs. Visit the T3Live Homepage, Virtual Trading Floor, and Learn More About Us.

