
By: Zev Spiro
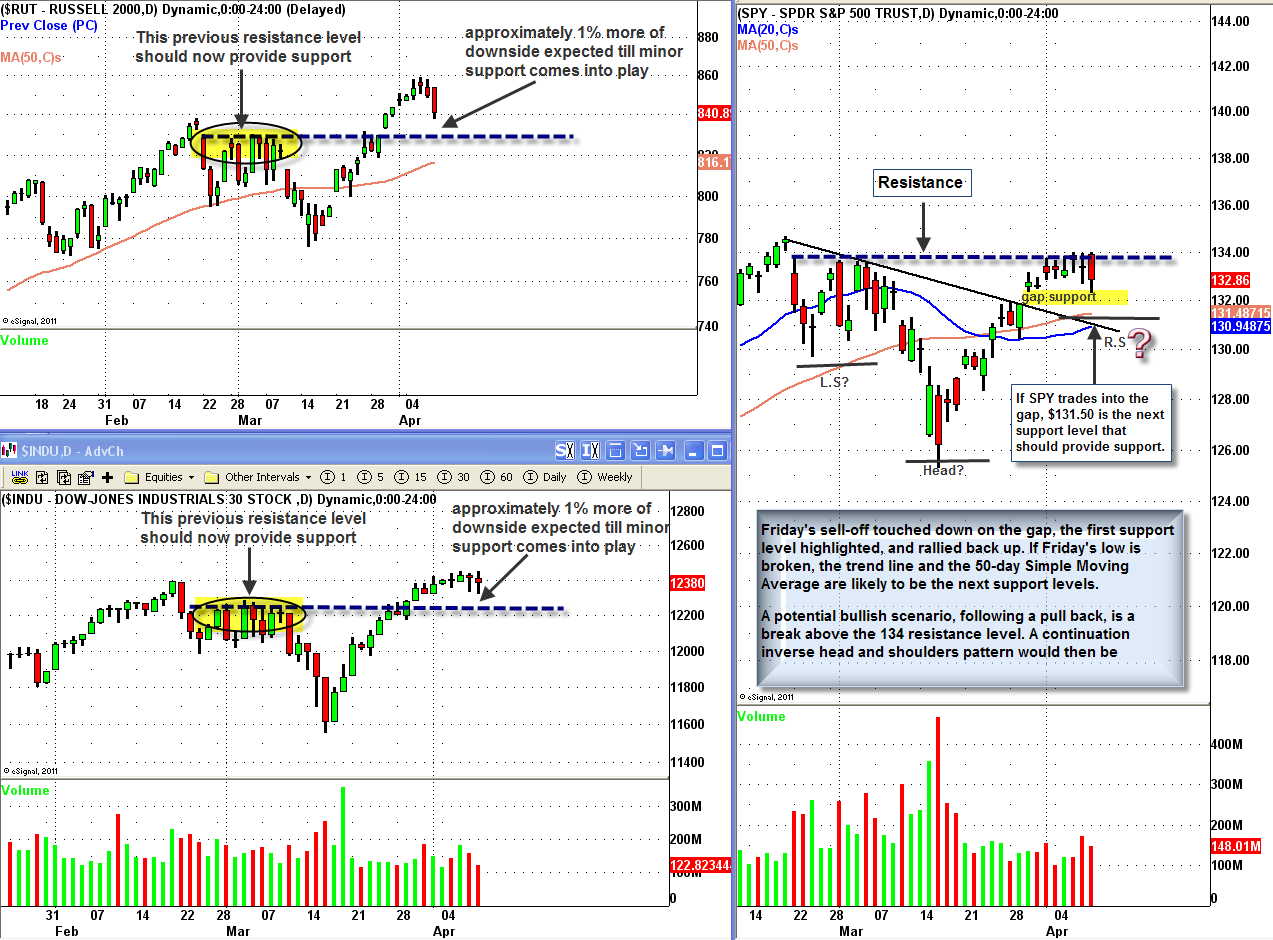
 Last week, a candlestick pattern was outlined in SPY, displaying signs of vulnerability, with confirmation on Thursday. Friday’s sell-off touched down on the gap, the first support level highlighted, and rallied back up.
The Russell 2000 Index and Dow Jones Industrials look poised to pull back approximately 1% more to test their support levels, the previous resistance. If Friday’s low is broken in SPY, the trend line and the 50-day Simple Moving Average are likely to be the next support levels.
A potential bullish scenario, following a pull back, is a break above the 134 resistance level. A continuation inverse head and shoulders pattern would then be triggered with a minimum expected price objective of $143. Below are charts of SPY and the indexes mentioned, as well as, a trade idea in IPG Photonics Corporation (IPGP).
Chart 1: Daily chart of SPY, Russell 2000 Index and Dow Jones Industrials illustrating potential support levels. In addition, a potential bullish scenario is outlined for SPY.
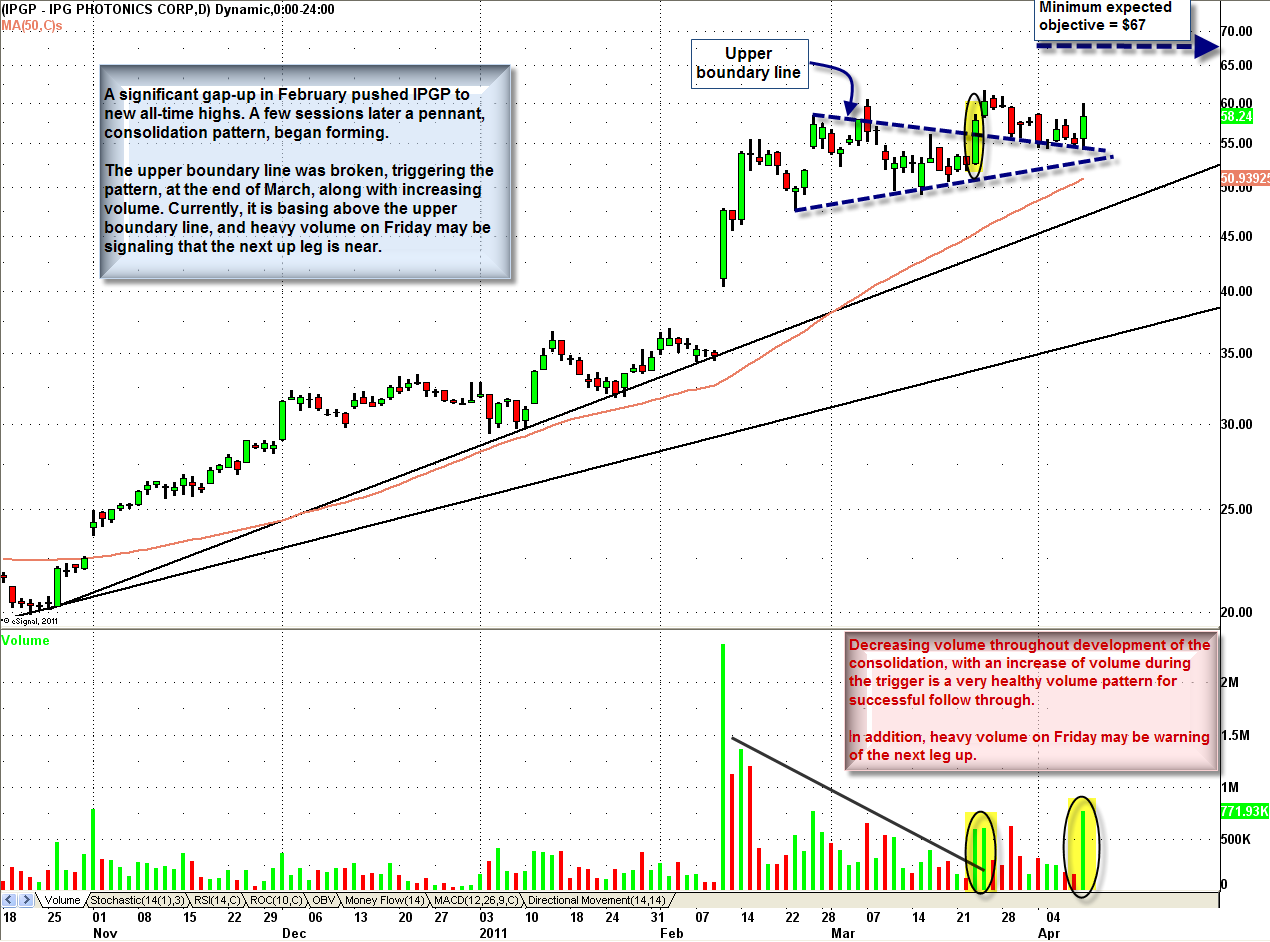
In February, a significant gap-up pushed IPGP to new all-time highs. A few sessions later a pennant, consolidation pattern, began forming. The upper boundary line was broken, triggering the pattern, at the end of March, along with increasing volume. Currently, it is basing above the upper boundary line, and heavy volume on Friday may be signaling that the next up leg is near.
Chart 2: The daily chart below outlines the pennant formation and breakout. Target: minimum expected price objective is $67, obtained by measuring the height of the pattern and expanding from the trigger point, by the same distance. Protective Stop: Daily close back below the upper boundary line.
If you are interested in receiving Zev Spiro’s market letter, please email zevspiro@oripsllc.com subject “T3â€
*DISCLOSURE: Long IPGP
This material is being provided to you for educational purposes only. No information presented constitutes a recommendation by T3 LIVE or its affiliates to buy, sell or hold any security, financial product or instrument discussed therein or to engage in any specific investment strategy. The content neither is, nor should be construed as, an offer, or a solicitation of an offer, to buy, sell, or hold any securities. You are fully responsible for any investment decisions you make. Such decisions should be based solely on your evaluation of your financial circumstances, investment objectives, risk tolerance and liquidity needs. Visit the T3Live Homepage, Virtual Trading Floor, and Learn More About Us.

