

By: Zev Spiro
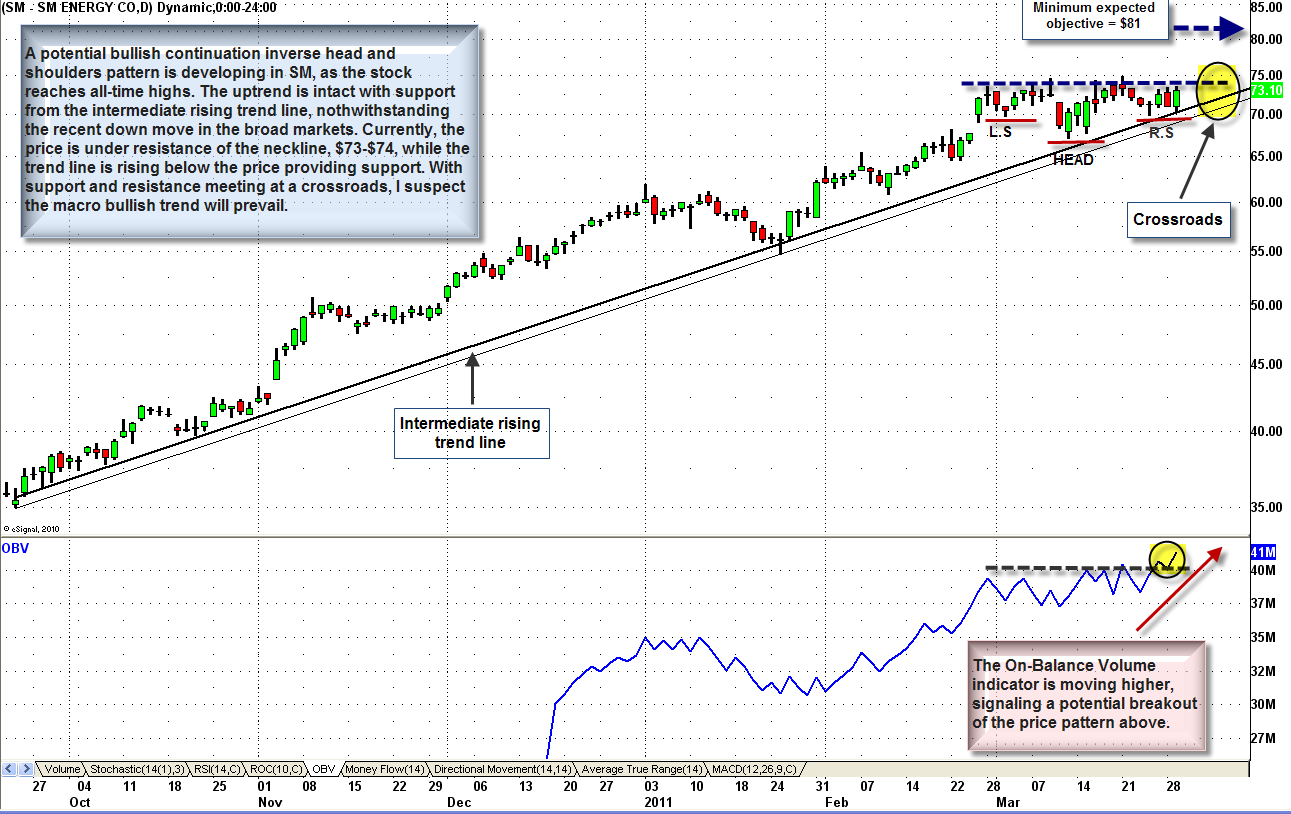
A potential bullish continuation inverse head and shoulders pattern is developing in SM Energy Company (SM), as the stock reaches all-time highs. The uptrend is intact with support from the intermediate rising trend line, notwithstanding the recent down move in the broad markets. Currently, the price is under resistance of the neckline, $73-$74, while the trend line is rising below the price providing support. With support and resistance meeting at a crossroads, I suspect the macro bullish trend will prevail.
Trigger: Daily close above $74, Target: minimum expected objective is $81, obtained by measuring the height of the pattern and expanding higher from the trigger point, by the same distance. Protective Stop: Confirmed move below $73, Trail Stop: confirmed break of the intermediate rising trend line.
If you are interested in receiving Zev Spiro’s market letter, please email zevspiro@oripsllc.com subject “T3”
*DISCLOSURE: No relevant position
This material is being provided to you for educational purposes only. No information presented constitutes a recommendation by T3 LIVE or its affiliates to buy, sell or hold any security, financial product or instrument discussed therein or to engage in any specific investment strategy. The content neither is, nor should be construed as, an offer, or a solicitation of an offer, to buy, sell, or hold any securities. You are fully responsible for any investment decisions you make. Such decisions should be based solely on your evaluation of your financial circumstances, investment objectives, risk tolerance and liquidity needs. Visit the T3Live Homepage, Virtual Trading Floor, and Learn More About Us.

