

By: Zev Spiro
Last week the bulls regained control of the 50-day simple moving averages in the major market indices. A fast move pushed the indices through minor resistance. Previous patterns’ boundary lines are being approached, which may initially provide resistance. In the past weeks, confirmed bearish patterns have triggered, although many are failing.
When a confirmed pattern fails, it has the potential to make a strong move in the opposite direction. Several shorts were squeezed last week with stops triggering, which may be a bullish signal. The intermediate uptrend in the major market indices recently ended, therefore, any direction of trend, including sideways, is possible. Patience is key at these levels as one should wait for signs of a new confirmed trend while continuing to trade and monitor the patterns and signals of individual names.
Individual names and sectors, such as refiners, have constructive bullish chart patterns forming. Outlined below is McMoRan Exploration Co. (MMR), an oil and natural gas name that broke out last week. On February 15th, I highlighted MMR as a candidate for a potential upside breakout above $18. The pattern did not trigger and has changed slightly since then, but the implications are the same. Additionally, an example of a confirmed pattern in Con-Way Inc. (CNW) that failed is illustrated below. This failed pattern ignited into a powerful move in the opposite direction.
Chart 1: Illustrates the comparative relative strength of MMR versus SPY.
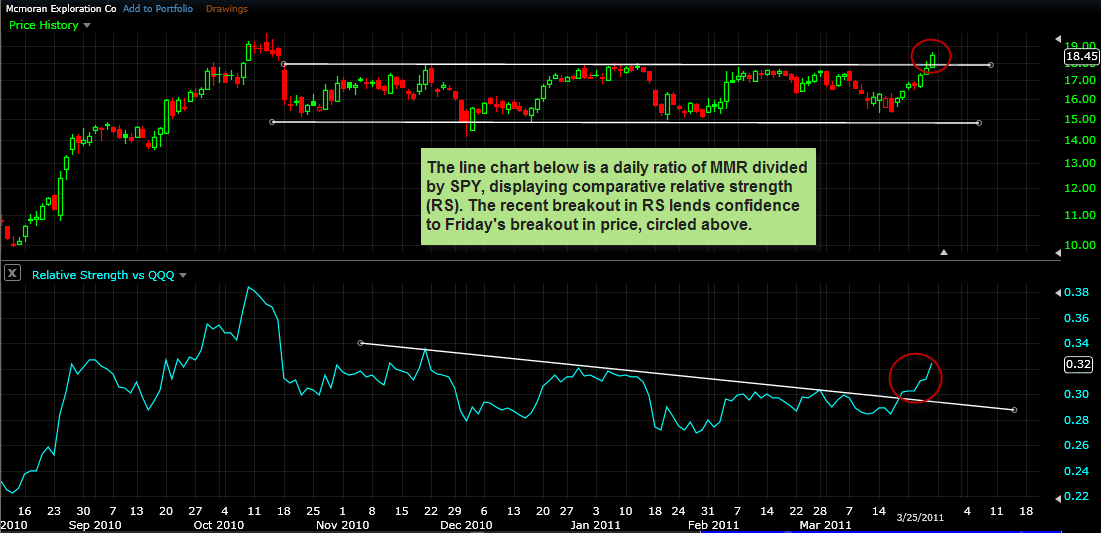
Chart 2: MMR broke out of a rectangle (basing) pattern on Friday after having a large up-move over the last several sessions. A throw back to the upper boundary line at $18, which is now support, will provide an excellent low-risk entry opportunity if the level holds. Target: minimum expected objective is between $21 and $22, obtained by measuring the height of the pattern and expanding from the breakout, by the same distance. Protective Stops: may trigger on a confirmed move back below the upper boundary line, at $18.
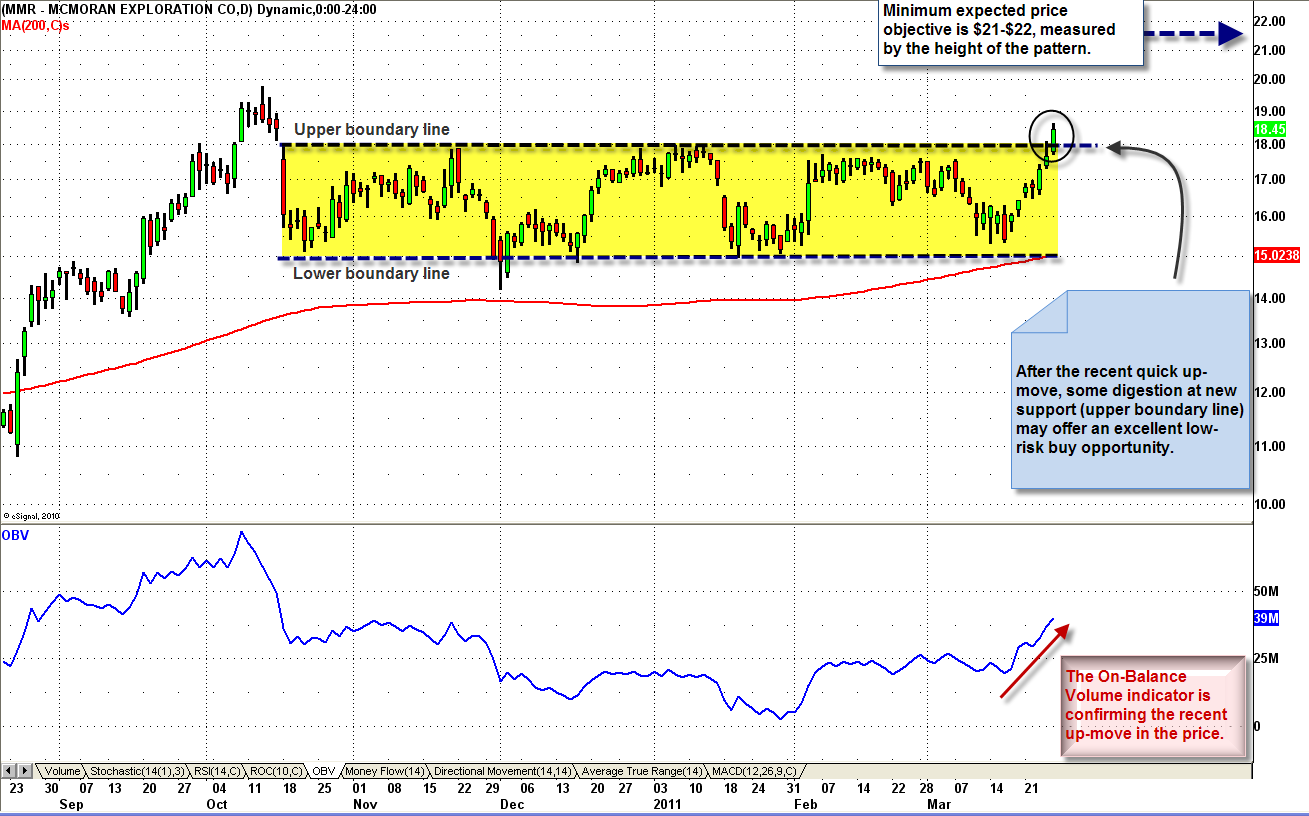
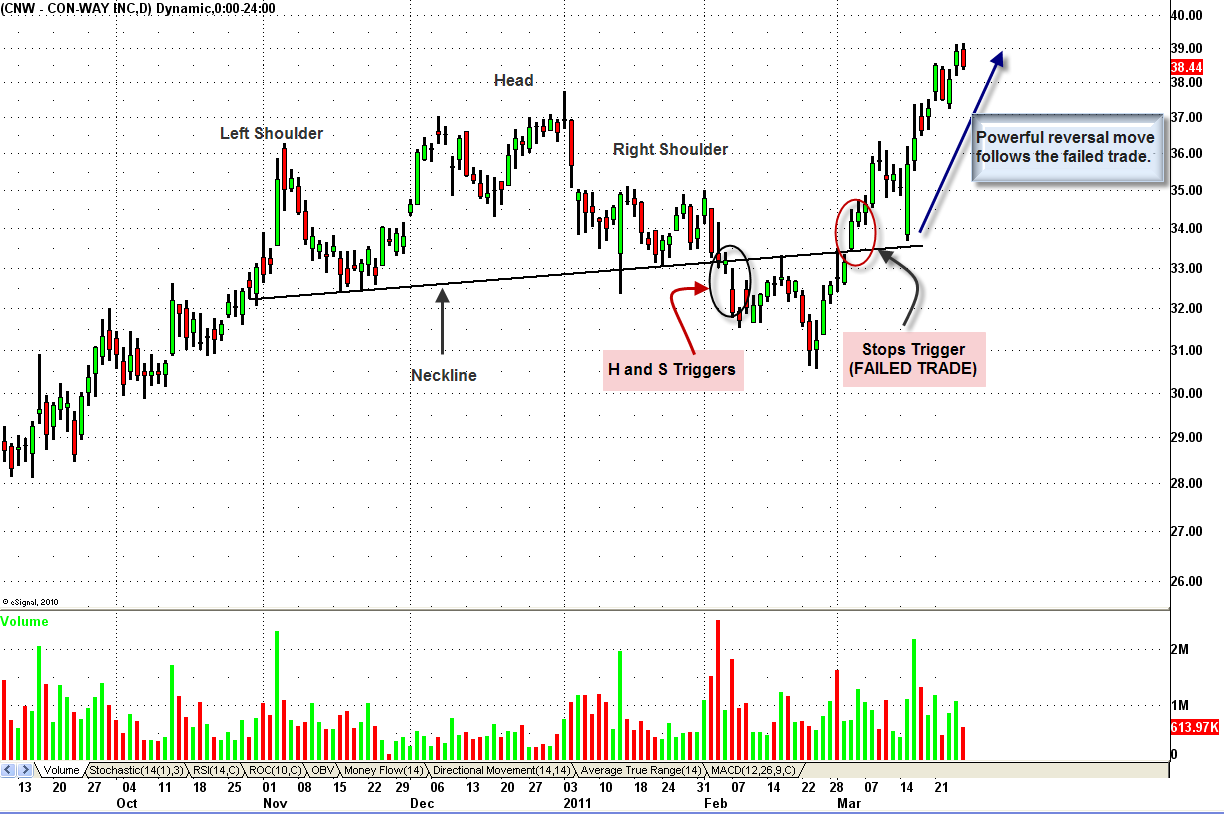
Chart 3: Outlined in the chart below is a bearish head and shoulders pattern in CNW that failed. After the failure a strong upside reversal followed. The same scenario is possible for confirmed bearish patterns that recently failed.
If you are interested in receiving Zev Spiro’s market letter, please email zevspiro@oripsllc.com subject “T3â€
*DISCLOSURE: Long SPY, MMR
This material is being provided to you for educational purposes only. No information presented constitutes a recommendation by T3 LIVE or its affiliates to buy, sell or hold any security, financial product or instrument discussed therein or to engage in any specific investment strategy. The content neither is, nor should be construed as, an offer, or a solicitation of an offer, to buy, sell, or hold any securities. You are fully responsible for any investment decisions you make. Such decisions should be based solely on your evaluation of your financial circumstances, investment objectives, risk tolerance and liquidity needs. Visit the T3Live Homepage, Virtual Trading Floor, and Learn More About Us.

