

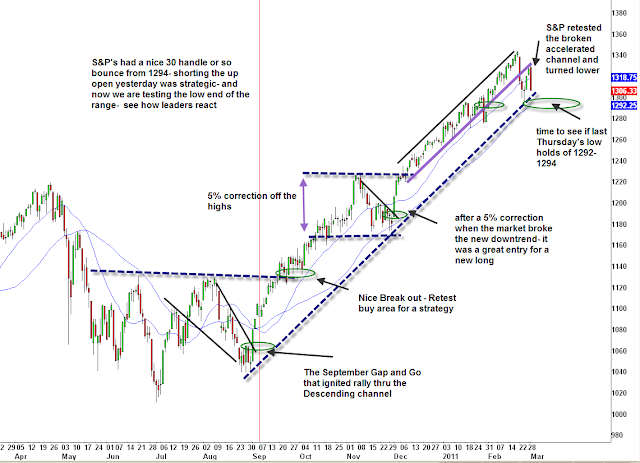
When the market accelerated out of the already-steep uptrend in February, I began getting cautious ahead of what I expected to be an eventual correction. Even before the breakdown on February 22, we were seeing sings under the hood that the market was not completely healthy. Over the course of the next three weeks, we have seen back-and-forth, indecisive action in the market. A wedge pattern has been formed, which is a period of consolidation and tightening ranges that usually precedes an explosive move. Active traders looking for early resolution and follow-through type moves have been pulling their hair out. As a learning tool, here is a timeline of charts I have sent out regarding the formation of the wedge pattern.
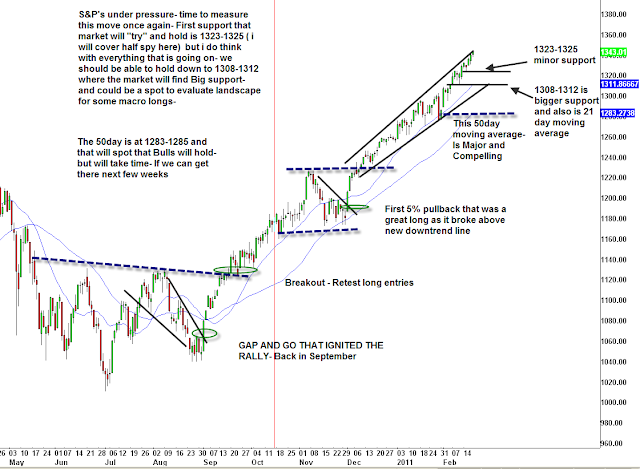
February 22, after seeing signs that the market was ready to pull-in a bit, the futures got hit hard overnight and I highlighted support areas to watch.
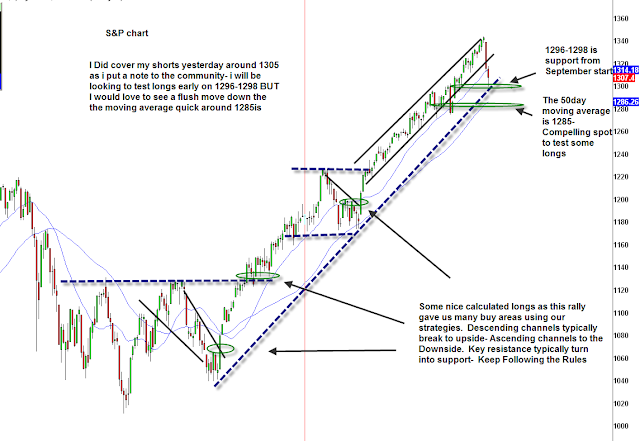
February 24, after two days of carnage, I took my trade and waited for the market to signal its next move.
February 28 we began to watch resistance levels in order to gauge the strength of the snap-back.
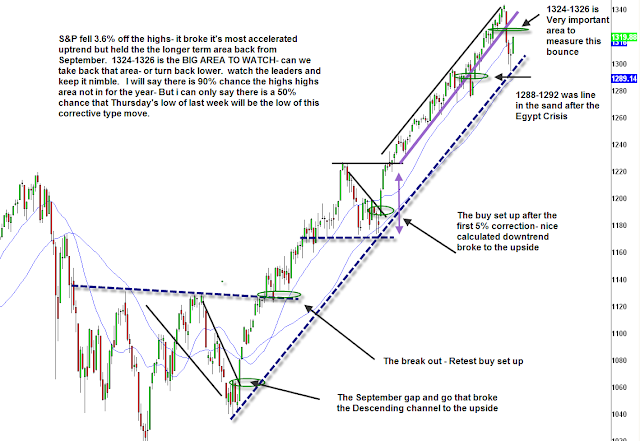
March 1, the market had pared a portion of its losses, but needed to prove itself further if I was going to chase longs.
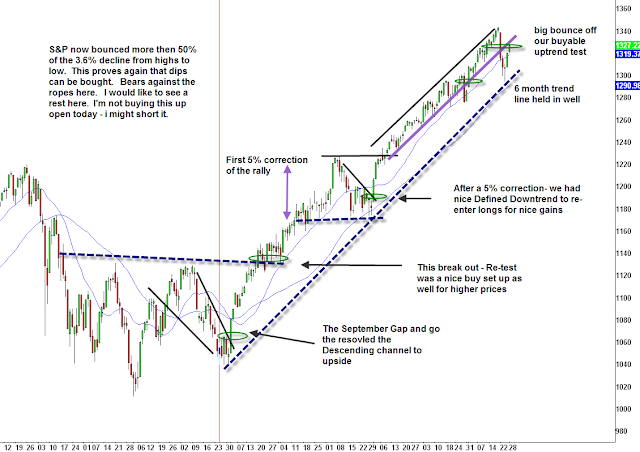
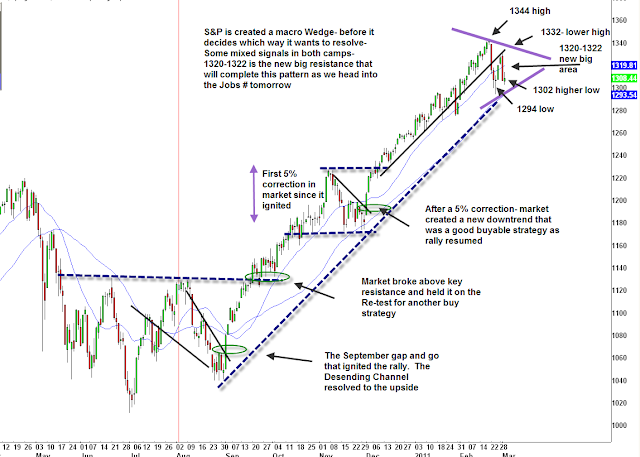
March 2 the market erased almost the entire bounce-back, and was once again testing the more long-term uptrend line. With the market starting to show indecision, I decided it would not be prudent to chase longs or shorts for longer trades until the range was resolved.
March 3 the market began to more clearly resemble a defined wedge pattern after a feeble bounce. From then on I looked to trade the range and identify relative strength and weakness in stocks and sectors each day.
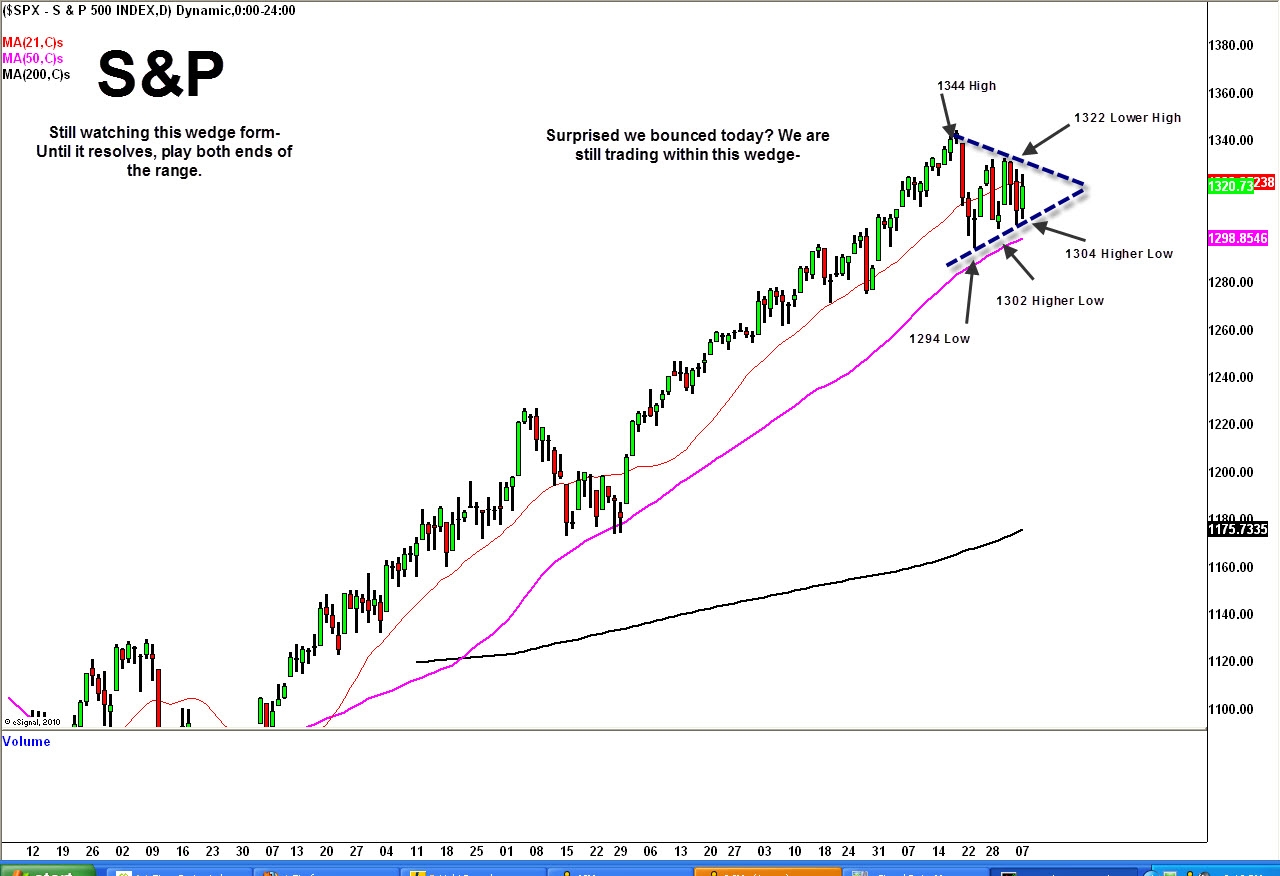
March 8 we bounced again off the lower trendline of the wedge, making it even more defined. Today we are seeing further tightening of the pattern, as investors gauge whether they can confidently buy at these levels with continued unrest in the Middle East and rising oil prices weighing on the recovery. We will not make any sort of guess on the direction the pattern will be resolved, but will let the price action point tell us the next big move.
*DISCLOSURE: Scott is long AMZN, GLD, BAC, INVE, MGM; Short SPY
This material is being provided to you for educational purposes only. No information presented constitutes a recommendation by T3 LIVE or its affiliates to buy, sell or hold any security, financial product or instrument discussed therein or to engage in any specific investment strategy. The content neither is, nor should be construed as, an offer, or a solicitation of an offer, to buy, sell, or hold any securities. You are fully responsible for any investment decisions you make. Such decisions should be based solely on your evaluation of your financial circumstances, investment objectives, risk tolerance and liquidity needs. Visit the T3Live Homepage, Virtual Trading Floor, and Learn More About Us.

