
By: Zev Spiro

REITS failed yesterday as bears took control across the board. Broad based selling created bearish candlestick patterns on all major market indices suggesting lower prices in the near term. Take cues from bearish patterns that triggered within the last couple of weeks, such as Freeport-McMoRan Copper & Gold Inc. (FCX), Southern Copper Corporation (SCCO), State Street Corp. (STT) and Triumph Group, Inc. (TGI). Those names retested resistance after triggering and turned down on heavy selling yesterday. The next play is to short other names that have been in distribution mode over the last several months and recently triggered.
Below are 5 short ideas in Patriot Coal Corp (PCX), Alpha Natural Resources Inc. (ANR), AO Smith Corp. (AOS), Monsanto Co. (MON) and Manpower Inc. (MAN) which all fit the distribution criteria and are close to triggering. Most of the distribution patterns found in these names is the Head and Shoulders pattern, which is statistically speaking of the most reliable reversal patterns.
Chart 1: Patriot Coal Corp (PCX): There is a cluster of support, circled and highlighted on the daily chart below, which if broken will result in a substantial move lower. The support comes from the 50-day Simple Moving Average (SMA), the intermediate bullish trendline and the neckline of a bearish head and shoulders reversal pattern. The 50-day SMA was violated yesterday and if there is a confirmed move below the neckline, which is at $22, then the pattern will trigger.
Trigger: Confirmed move below the neckline which is at $22, aggressive traders may anticipate a trigger and short at current prices with a stop above the $24.25 pivot high. Target: $15, Protective Stops: conservative: close above the recent pivot high at $24.25, aggressive: confirmed move back above the neckline.
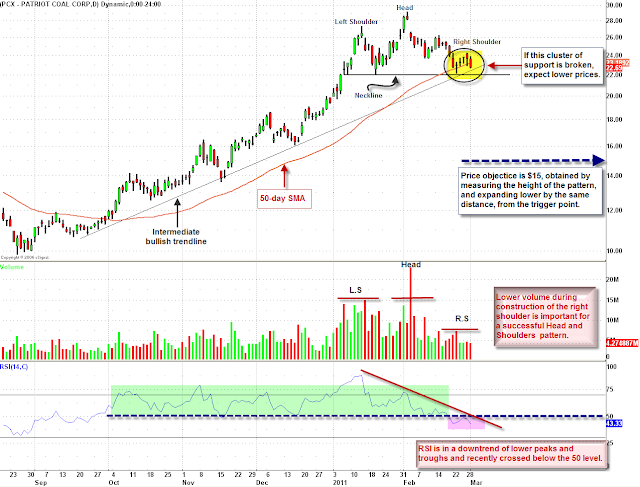
Chart 2: The comparative relative strength of PCX versus SPY already broke support which may be a warning of the potential break in price.
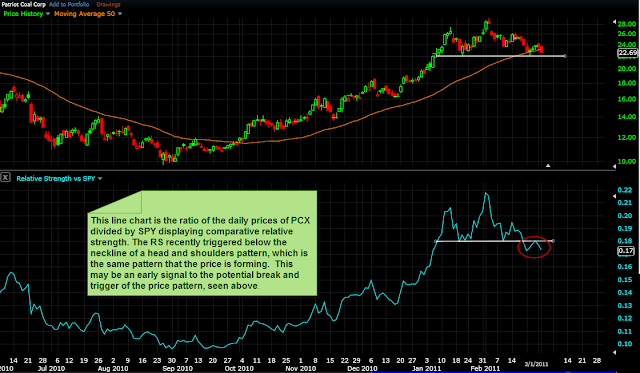
Chart 3: Alpha Natural Resources Inc. (ANR) is another coal name with a similar bearish head and shoulders pattern as PCX. The intermediate bullish trend line and 50-Day SMA were already broken on January 31st.
Trigger: confirmed break below the neckline, which is currently at $52.50. Target: $36, which was obtained by measuring the height of the pattern and expanding lower from the trigger point, by the same distance, Protective Stops: conservative: close above the 50 day SMA, aggressive: either a confirmed move back above the neckline, or a close above the recent pivot high at $55.17.
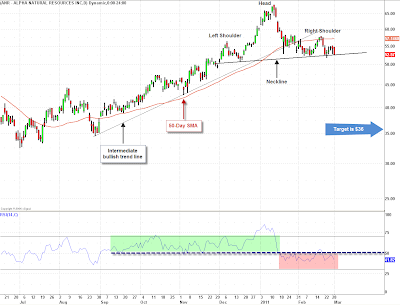
Chart 4: AO Smith Corp. (AOS) is trading above a 22 month primary bullish support line, drawn on the left chart. This trendline is extremely important based on the presence of the three key characteristics that increase the validity of a trendline: 1) the slope, 2) number of times touched and 3) duration of a trendline. A break of this trend line is extremely significant and would signal the end of the uptrend.
A symmetrical triangle is outlined on the right chart. A confirmed break below the lower boundary line would trigger the pattern and would coincide with a break of the primary bullish support line, adding weight to the bearish evidence.
Trigger: confirmed break below the lower boundary line, approximately $39.50. Target: $31, generated by measuring the height of the pattern and expanding lower by the same distance. Protective Stop: 1) a confirmed move back above the lower boundary line, or 2) a close above the recent pivot high at $40.83, whichever is higher.
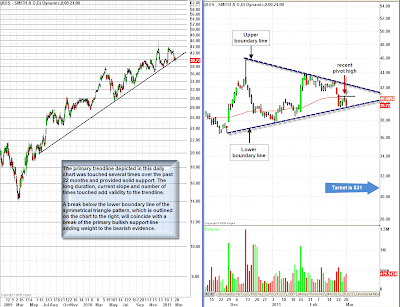
Chart 5: Monsanto Co. (MON) recently broke it’s intermediate up trend line signaling an end to the uptrend. In addition, a bearish head and shoulders pattern has been developing since the beginning of the year.
Trigger: Confirmed break of the neckline, which is at approximately $69.35. Target: Minimum expected price objective is $61.50, measured by the height of the pattern. Protective Stops: aggressive: confirmed move back above the neckline, conservative: A close above the high of the right shoulder, which is $72.61.
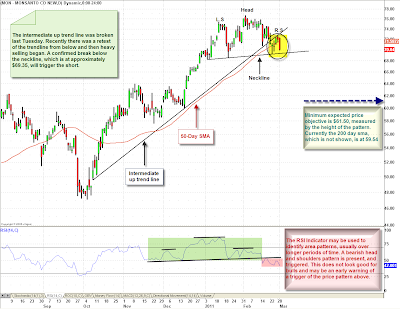
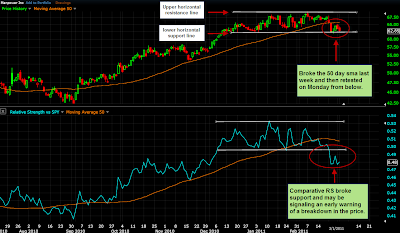
Chart 6: Manpower Inc. (MAN) has been in a sideways (basing) rectangle pattern since mid-December. Five days ago, the 50 day simple moving average was broken with authority, and then on Monday it was retested from below. If there is a break of the lower horizontal support line, which is at $62, then the trade triggers with a minimum expected price objective of $55.
An early warning of a potential downside trigger can be seen from the comparative relative strength (RS) of MAN versus SPY, which already broke support.
Trigger: confirmed break of the lower horizontal support line, which is $62. Target: $55, Protective Stops: confirmed move back above the support line.
If you are interested in receiving Zev Spiro’s market letter, please email zevspiro@oripsllc.com subject “T3”
*DISCLOSURE: Short PCX, AOS, FCX, SCCO, TGI, STT, GS, STRI
This material is being provided to you for educational purposes only. No information presented constitutes a recommendation by T3 LIVE or its affiliates to buy, sell or hold any security, financial product or instrument discussed therein or to engage in any specific investment strategy. The content neither is, nor should be construed as, an offer, or a solicitation of an offer, to buy, sell, or hold any securities. You are fully responsible for any investment decisions you make. Such decisions should be based solely on your evaluation of your financial circumstances, investment objectives, risk tolerance and liquidity needs. Visit the T3Live Homepage, Virtual Trading Floor, and Learn More About Us.

